Free US Influencer Marketing Growth by Industry from 2015 to 2025 Chart
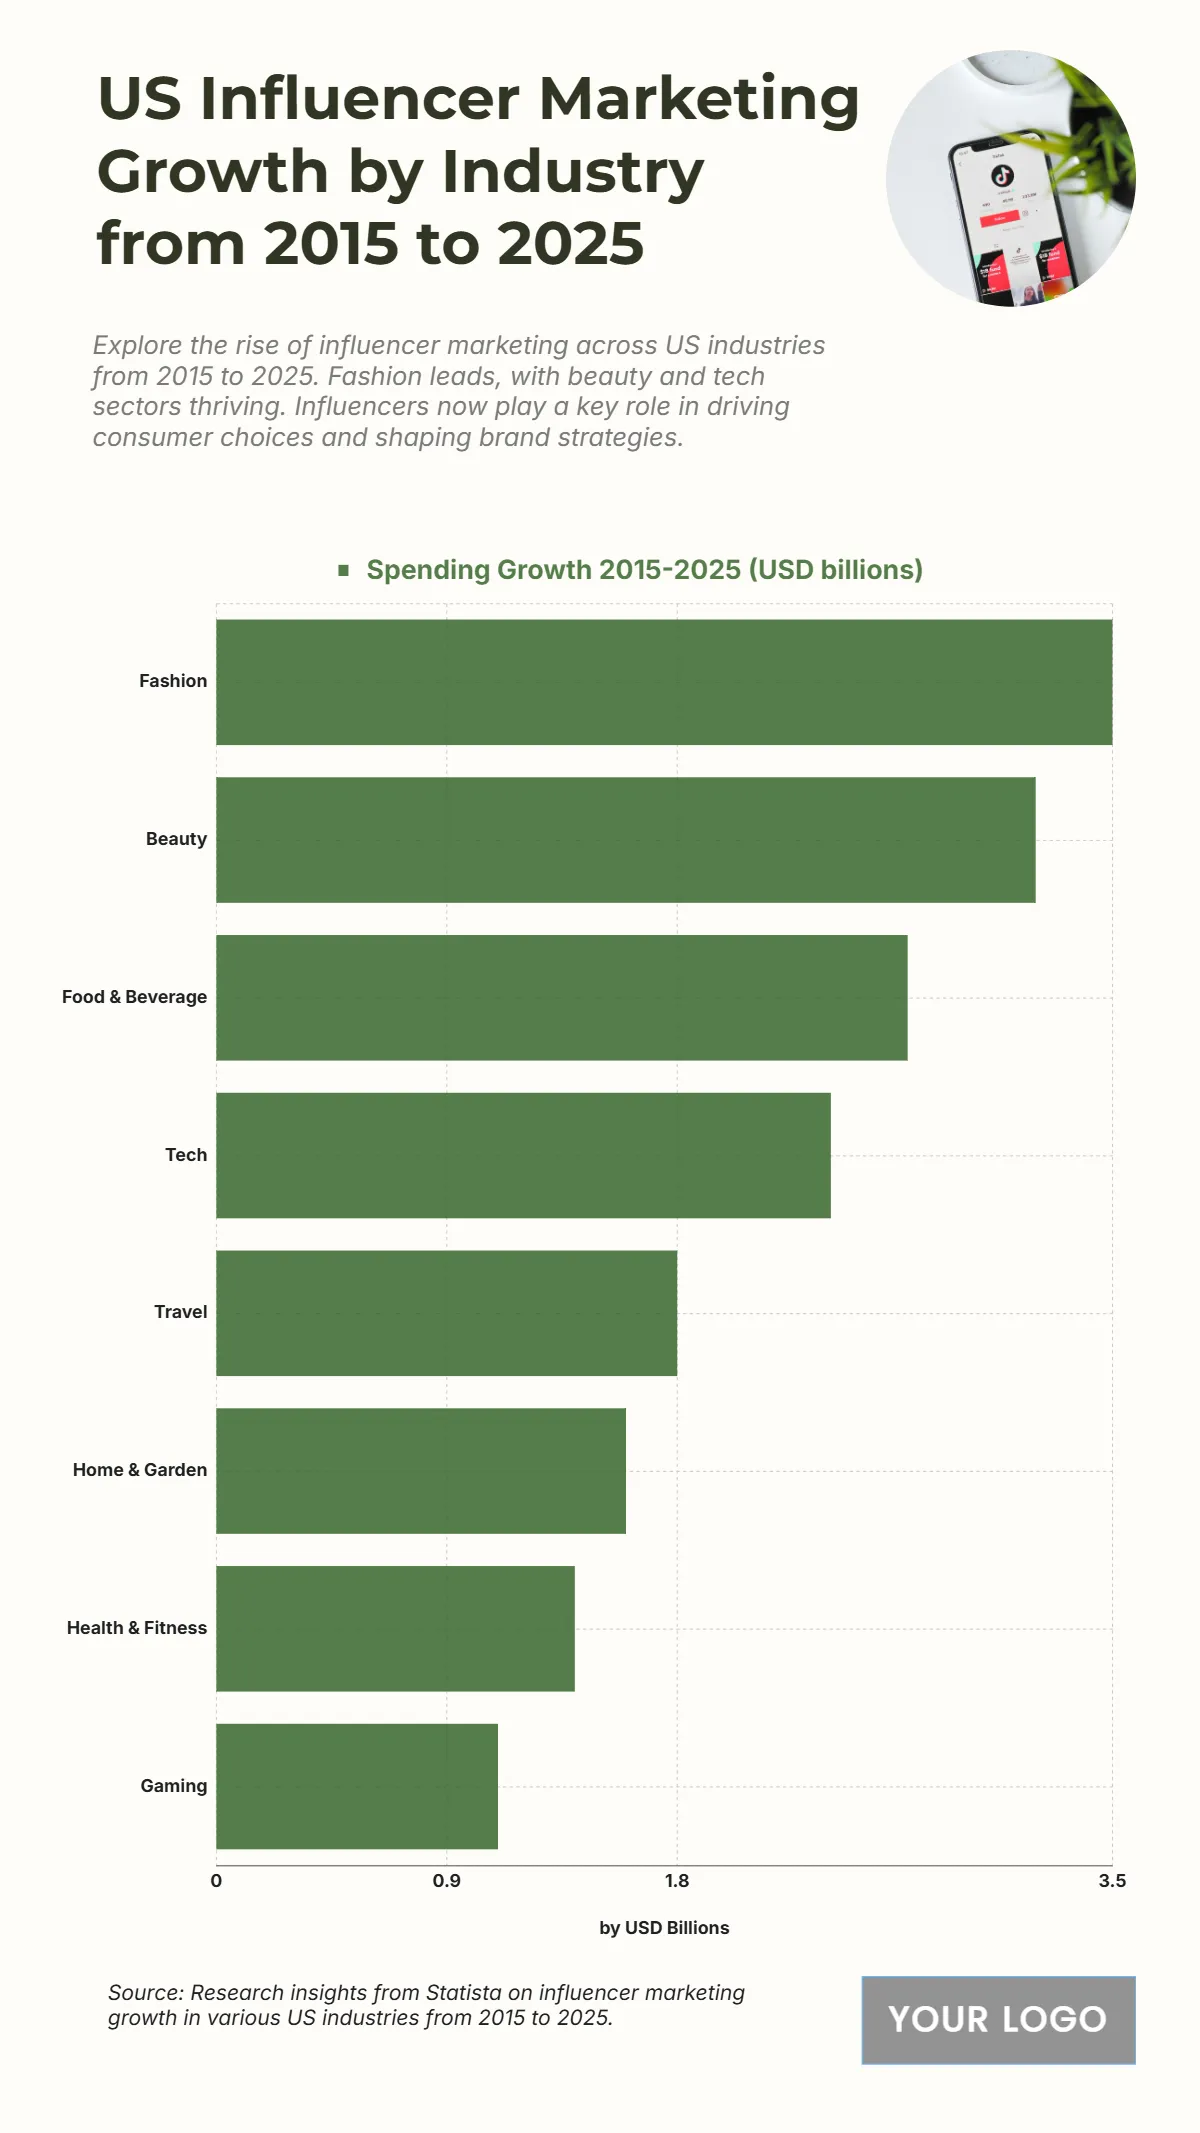
The chart reveals the steady expansion of U.S. influencer marketing spending across industries from 2015 to 2025, highlighting how social media influence reshapes marketing priorities. Fashion dominates the landscape, achieving the highest spending growth at $3.5 billion, driven by visual storytelling and influencer collaborations on platforms like Instagram and TikTok. Beauty follows closely at $3.2 billion, reflecting the sector’s reliance on digital creators for product reviews and brand authenticity. Food & Beverage ranks third with $2.7 billion, fueled by lifestyle content and experiential marketing trends. The Tech sector also shows strong growth at $2.4 billion, emphasizing the integration of gadgets and innovation in influencer campaigns. Travel reaches $1.8 billion, boosted by social content promoting experiences, while Home & Garden and Health & Fitness record $1.6 billion and $1.4 billion, respectively. Gaming rounds out the list with $1.1 billion, showing steady growth driven by streamers and digital communities.
| Labels | Spending Growth 2015–2025 (USD billions) |
|---|---|
| Fashion | 3.5 |
| Beauty | 3.2 |
| Food & Beverage | 2.7 |
| Tech | 2.4 |
| Travel | 1.8 |
| Home & Garden | 1.6 |
| Health & Fitness | 1.4 |
| Gaming | 1.1 |


