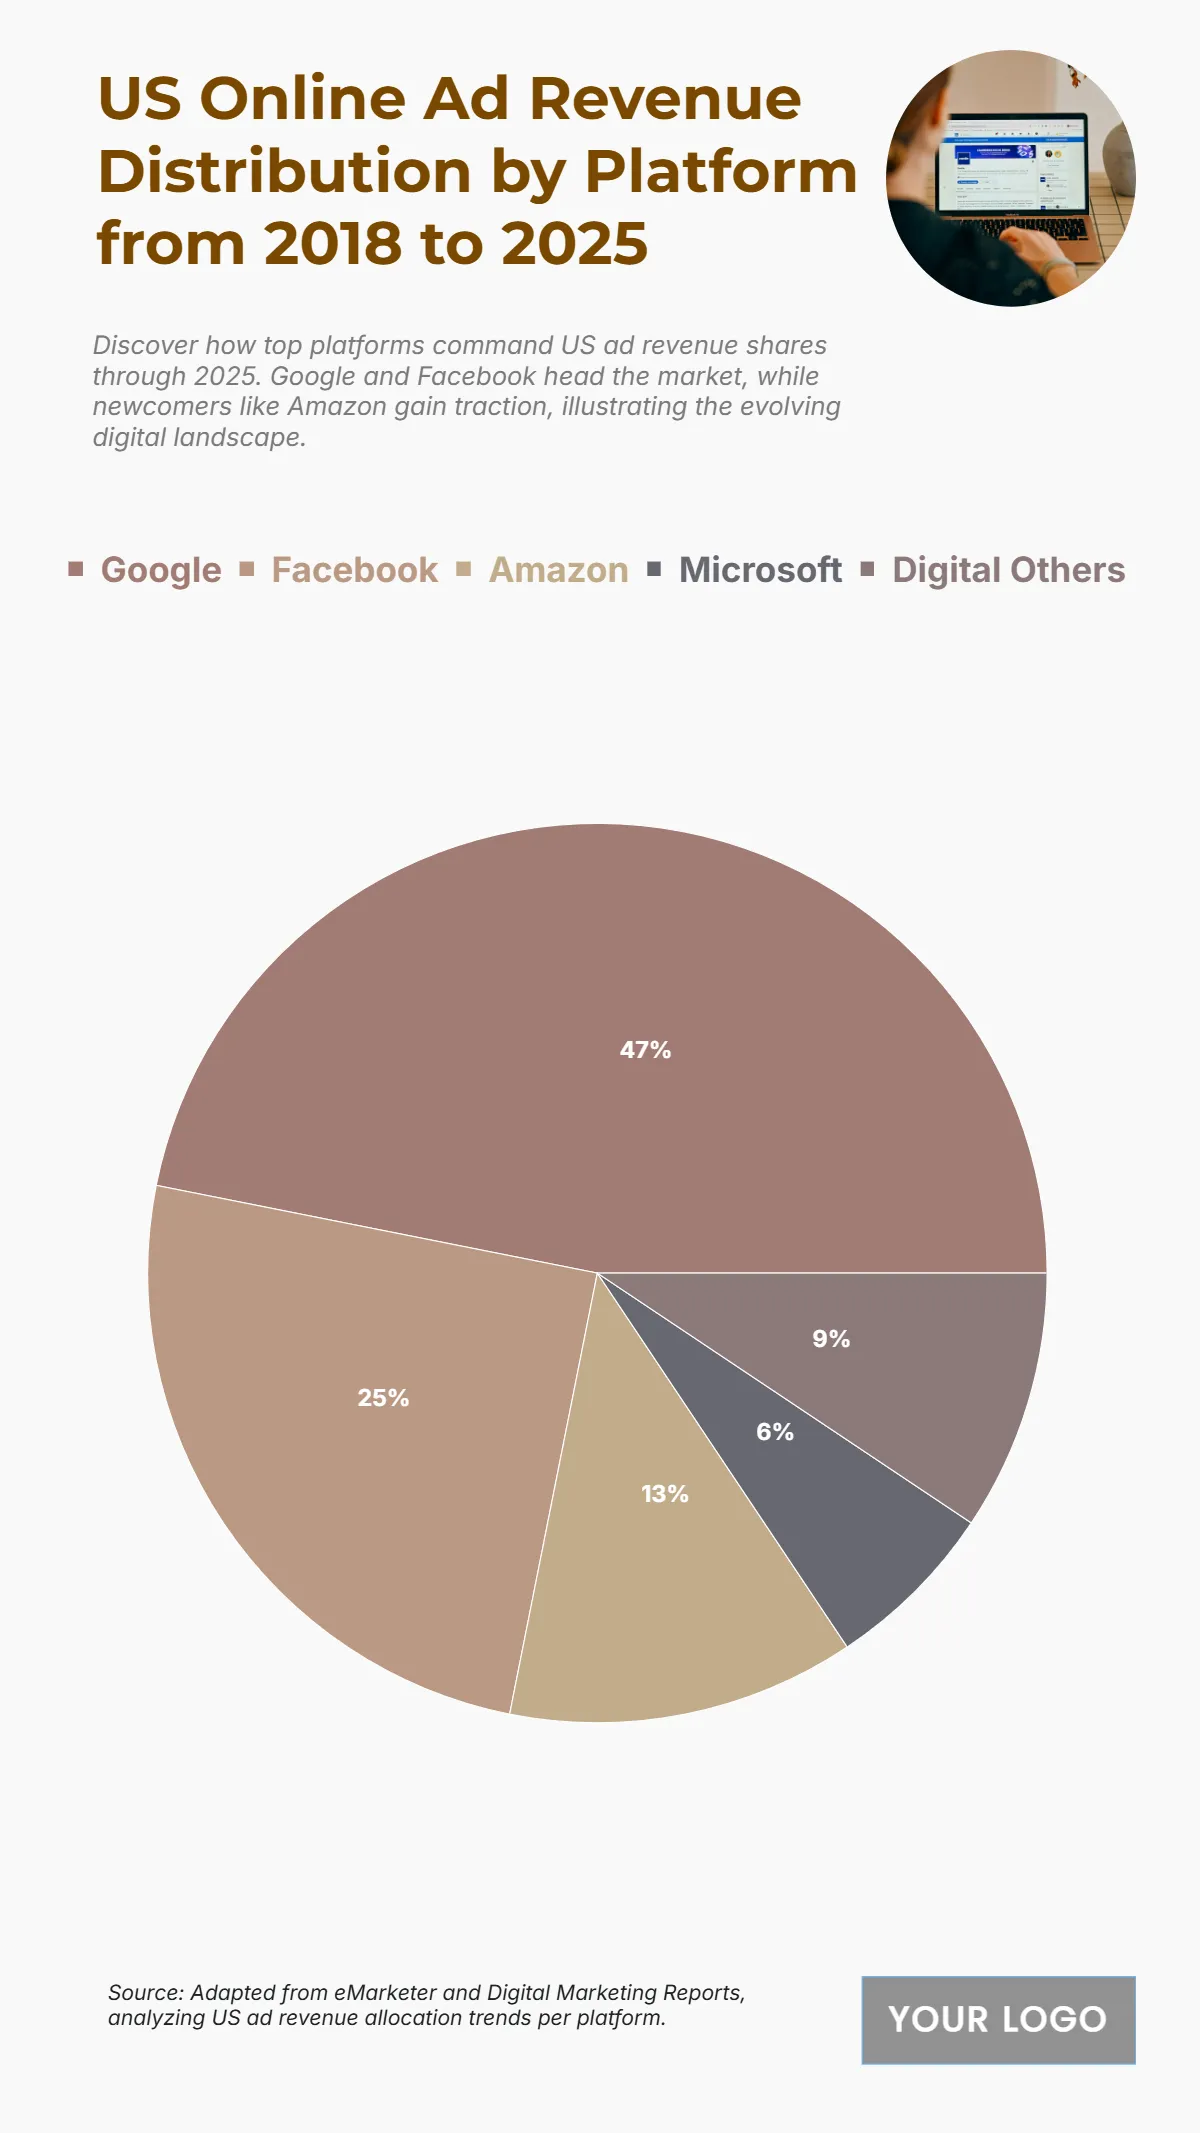
Free US Online Ad Revenue Distribution by Platform from 2018 to 2025 Chart
The chart highlights how Google dominates the U.S. online ad revenue market between 2018 and 2025, securing an overwhelming 47% share and generating approximately $150 billion. Facebook follows as the second-largest player, with a 25% share and $80 billion in total revenue, driven by its strong social media advertising network. Amazon ranks third, capturing 13% of the market with $40 billion, reflecting its rapid growth in e-commerce advertising. Meanwhile, Microsoft accounts for 6% of the total, contributing around $20 billion, supported by its search and display ad segments. Other digital platforms collectively hold 9%, equating to $30 billion, signifying the emergence of niche ad providers and new entrants in the market. The chart underscores how the U.S. digital ad ecosystem remains highly concentrated, with Google and Facebook collectively controlling over 70% of total ad revenues during this period, despite growing competition from Amazon and smaller digital players.
| Labels | 2018–2025 Total Revenue (in billions) |
|---|---|
| 150 | |
| 80 | |
| Amazon | 40 |
| Microsoft | 20 |
| Digital Others | 30 |


