Free US Average Customer Acquisition Cost by Industry from 2018 to 2025 Chart
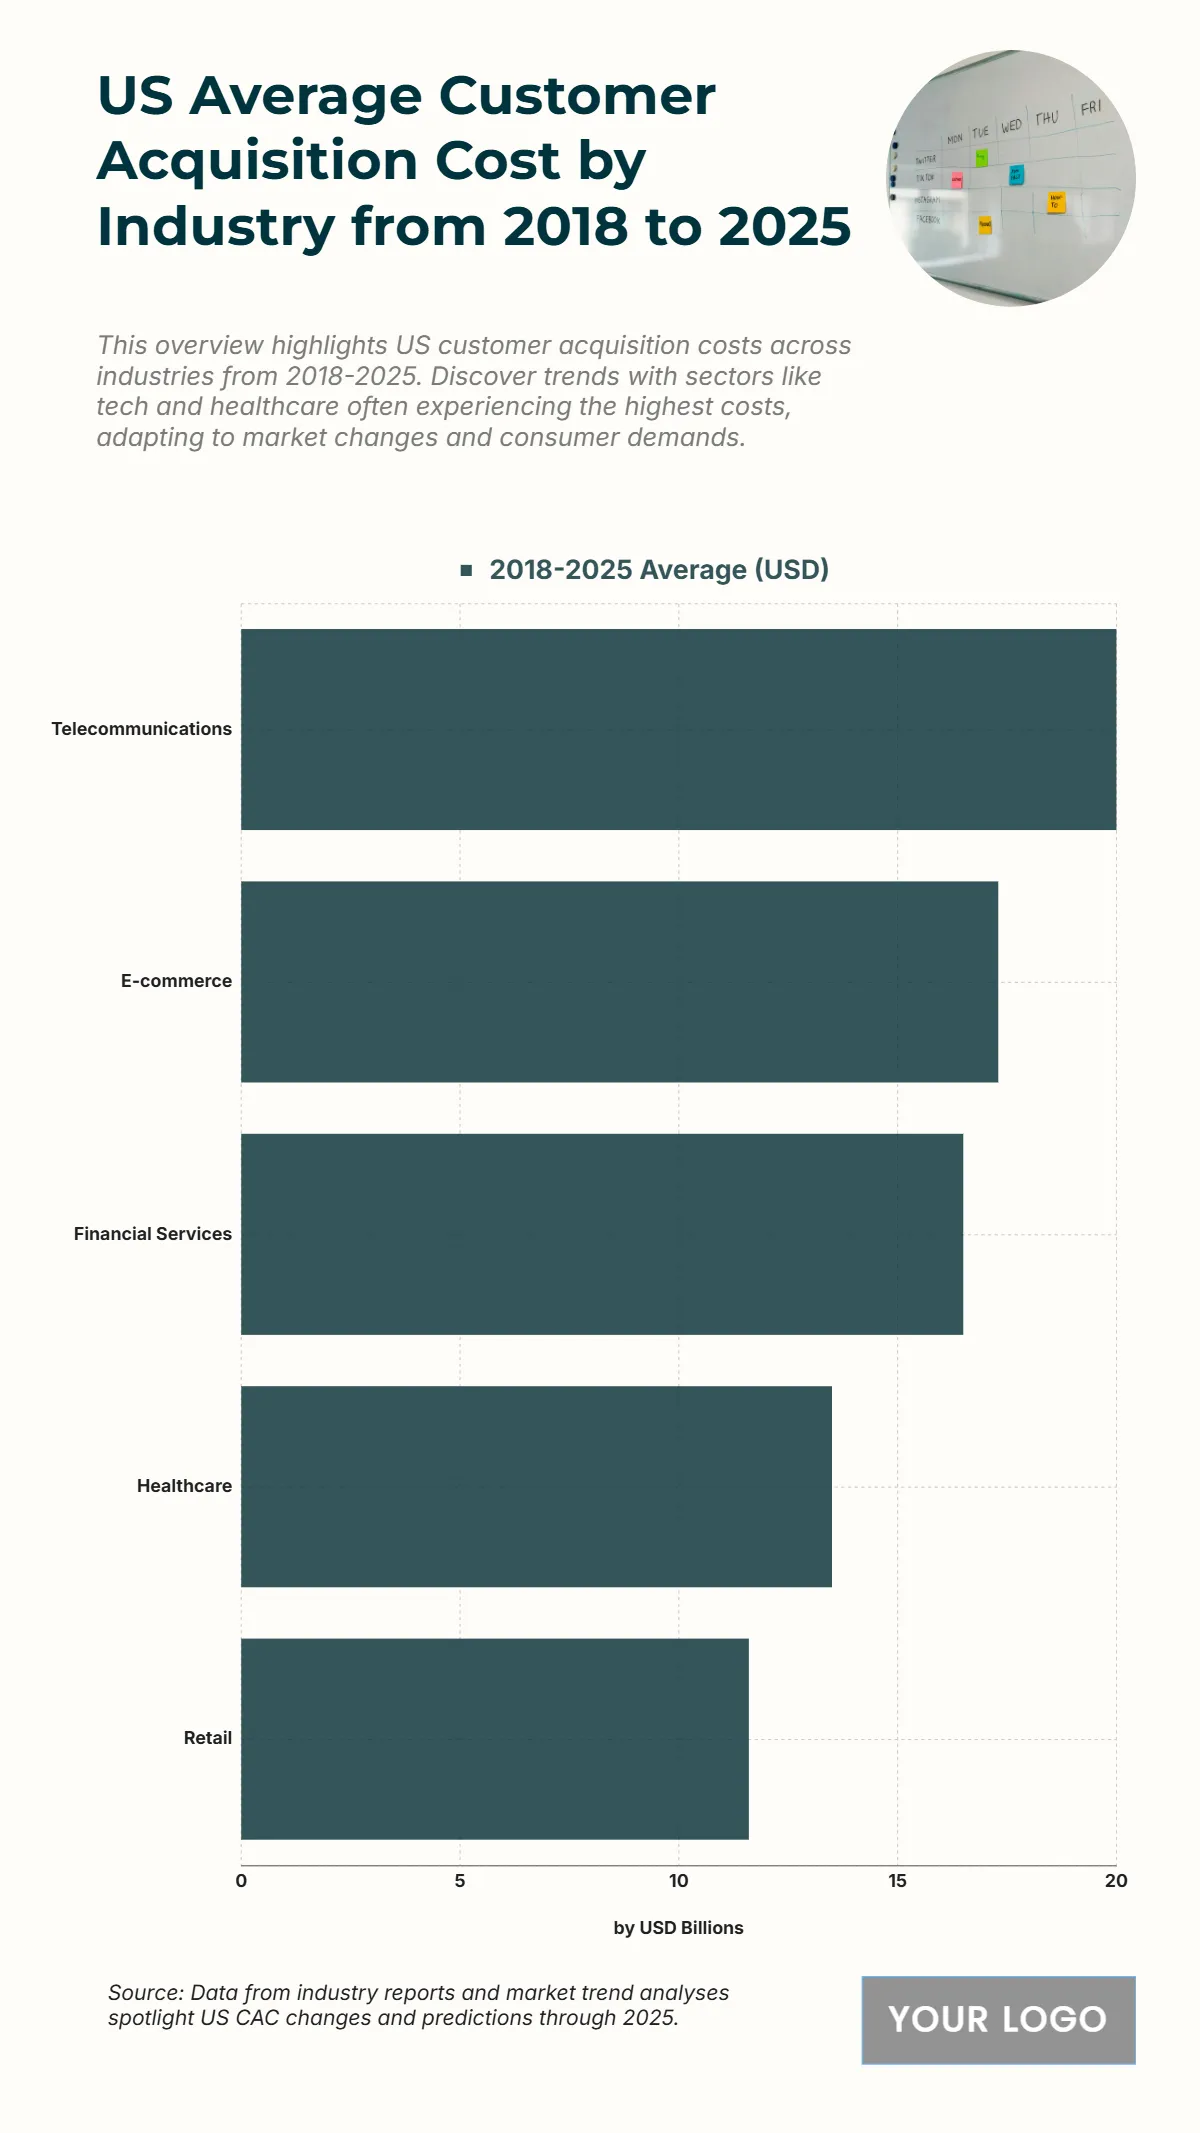
The chart highlights the average customer acquisition cost (CAC) across major U.S. industries from 2018 to 2025, revealing how much companies invest to attract new customers. Telecommunications leads with the highest CAC at $20 billion, reflecting the sector’s intense competition and infrastructure costs. E-commerce follows closely at $17.3 billion, showcasing strong digital marketing investments to drive online sales and retain customers in a crowded marketplace. Financial services report an average cost of $16.5 billion, driven by regulatory complexities and the demand for personalized digital engagement. Meanwhile, healthcare reaches $13.5 billion, influenced by patient acquisition strategies and digital health services. Retail, though lower at $11.6 billion, maintains steady growth through omnichannel marketing and loyalty programs. Overall, the data underscores the rising costs of customer acquisition in digitally competitive environments, emphasizing the need for innovation, automation, and customer retention strategies to sustain profitability across industries.
| Labels | 2018–2025 Average (USD billions) |
|---|---|
| Telecommunications | 20 |
| E-commerce | 17.3 |
| Financial Services | 16.5 |
| Healthcare | 13.5 |
| Retail | 11.6 |


