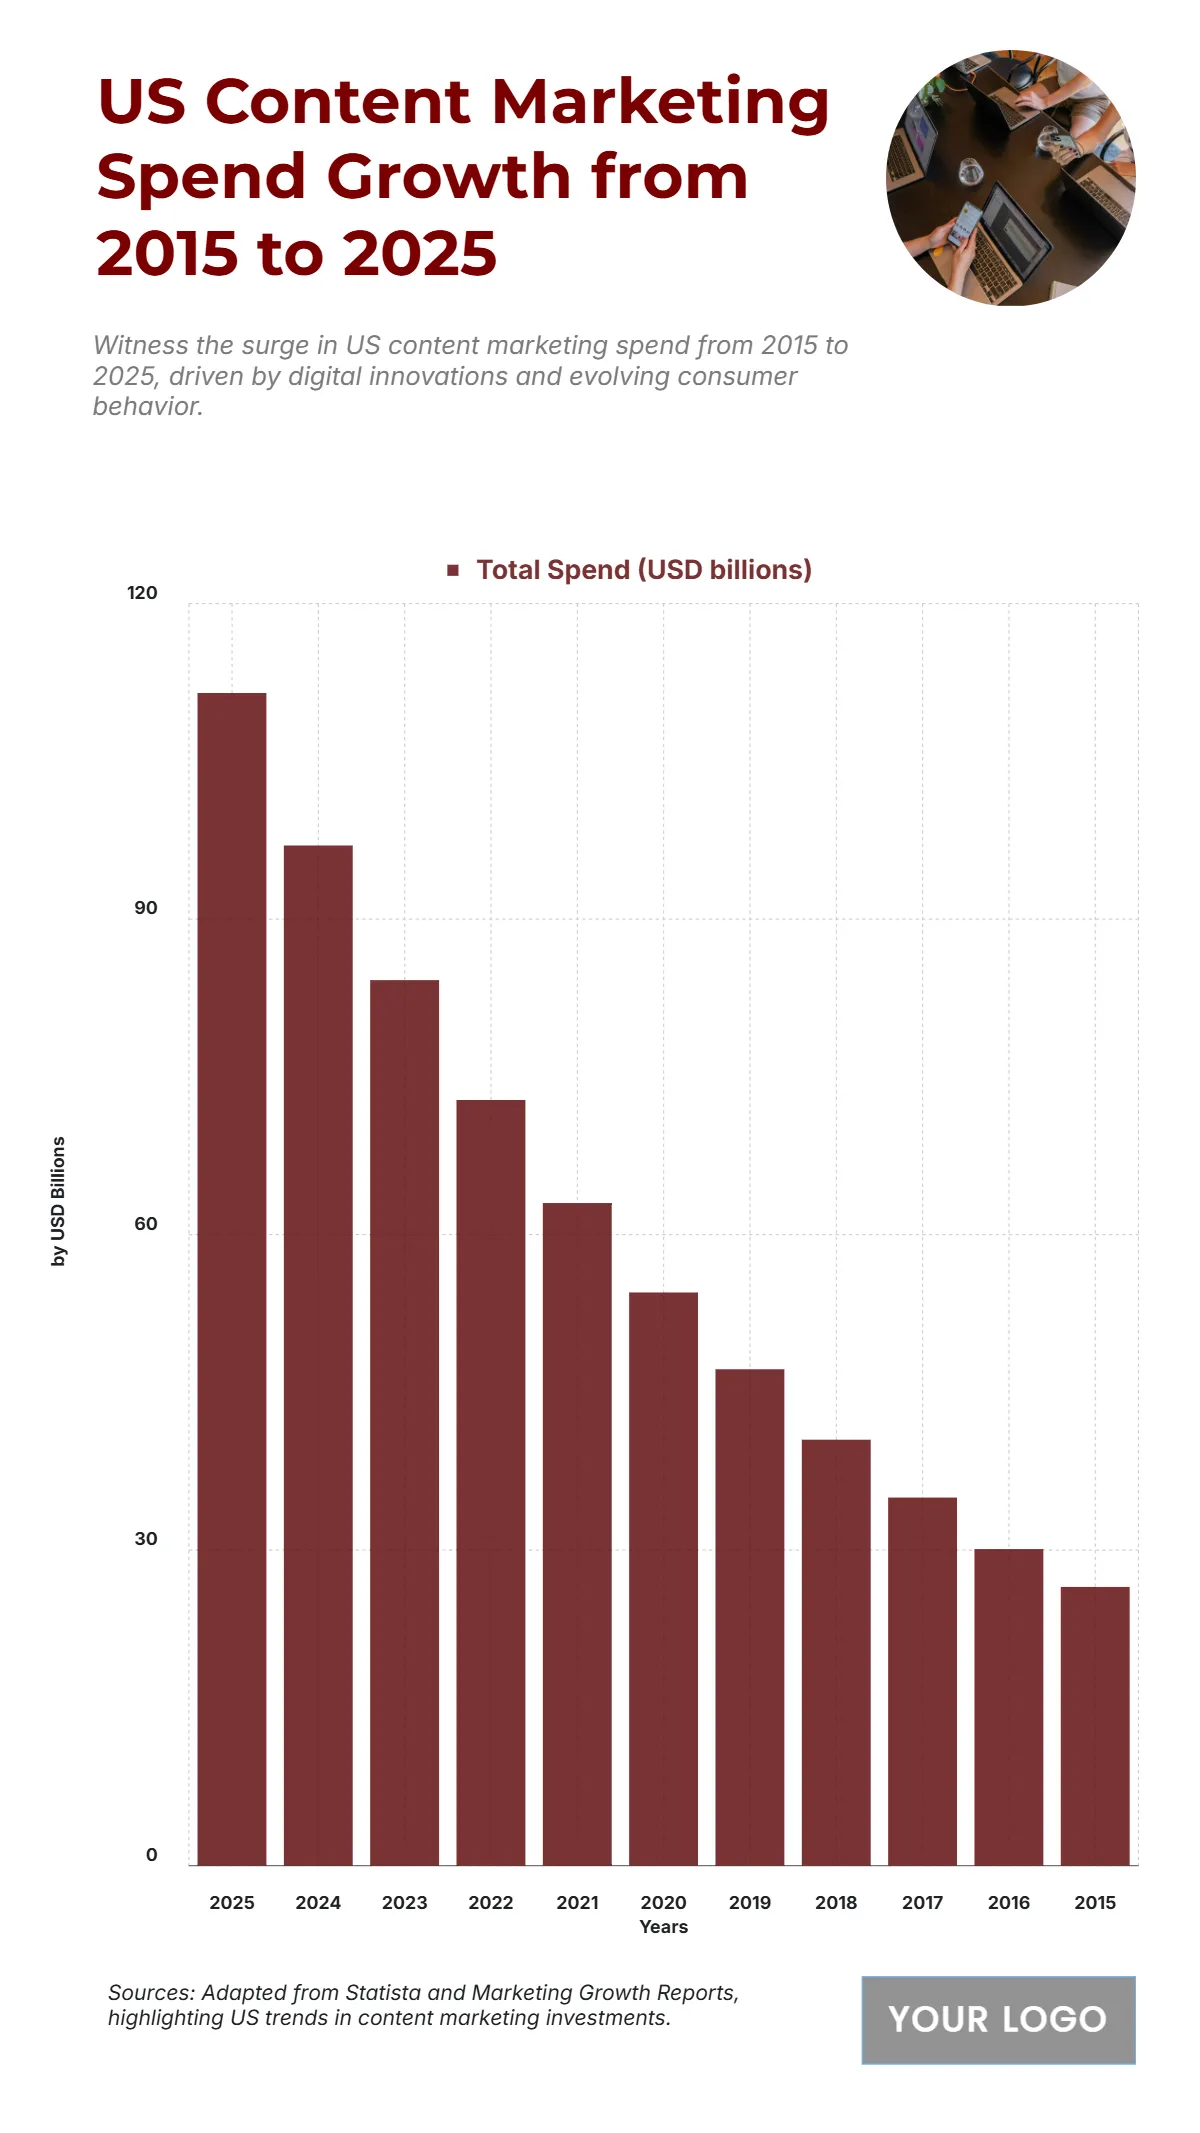
Free US Content Marketing Spend Growth from 2015 to 2025 Chart
The chart shows the consistent rise in U.S. content marketing spending from 2015 to 2025, highlighting how brands increasingly invest in digital storytelling and audience engagement. Starting at $26.5 billion in 2015, total spending gradually grew to $30.1 billion in 2016, $35 billion in 2017, and $40.5 billion in 2018, reflecting early adoption of digital strategies. By 2019, the figure reached $47.2 billion, then surged to $54.5 billion in 2020 and $63 billion in 2021, fueled by social media and influencer-driven campaigns. The upward momentum continued with $72.8 billion in 2022, $84.2 billion in 2023, and $97 billion in 2024, before peaking at $111.5 billion in 2025. This decade-long growth underscores the sector’s digital transformation, where content has become central to brand marketing, customer retention, and e-commerce engagement, emphasizing the shift toward immersive and data-driven marketing ecosystems.
| Labels | Total Spend (USD billions) |
|---|---|
| 2025 | 111.5 |
| 2024 | 97 |
| 2023 | 84.2 |
| 2022 | 72.8 |
| 2021 | 63 |
| 2020 | 54.5 |
| 2019 | 47.2 |
| 2018 | 40.5 |
| 2017 | 35 |
| 2016 | 30.1 |
| 2015 | 26.5 |


