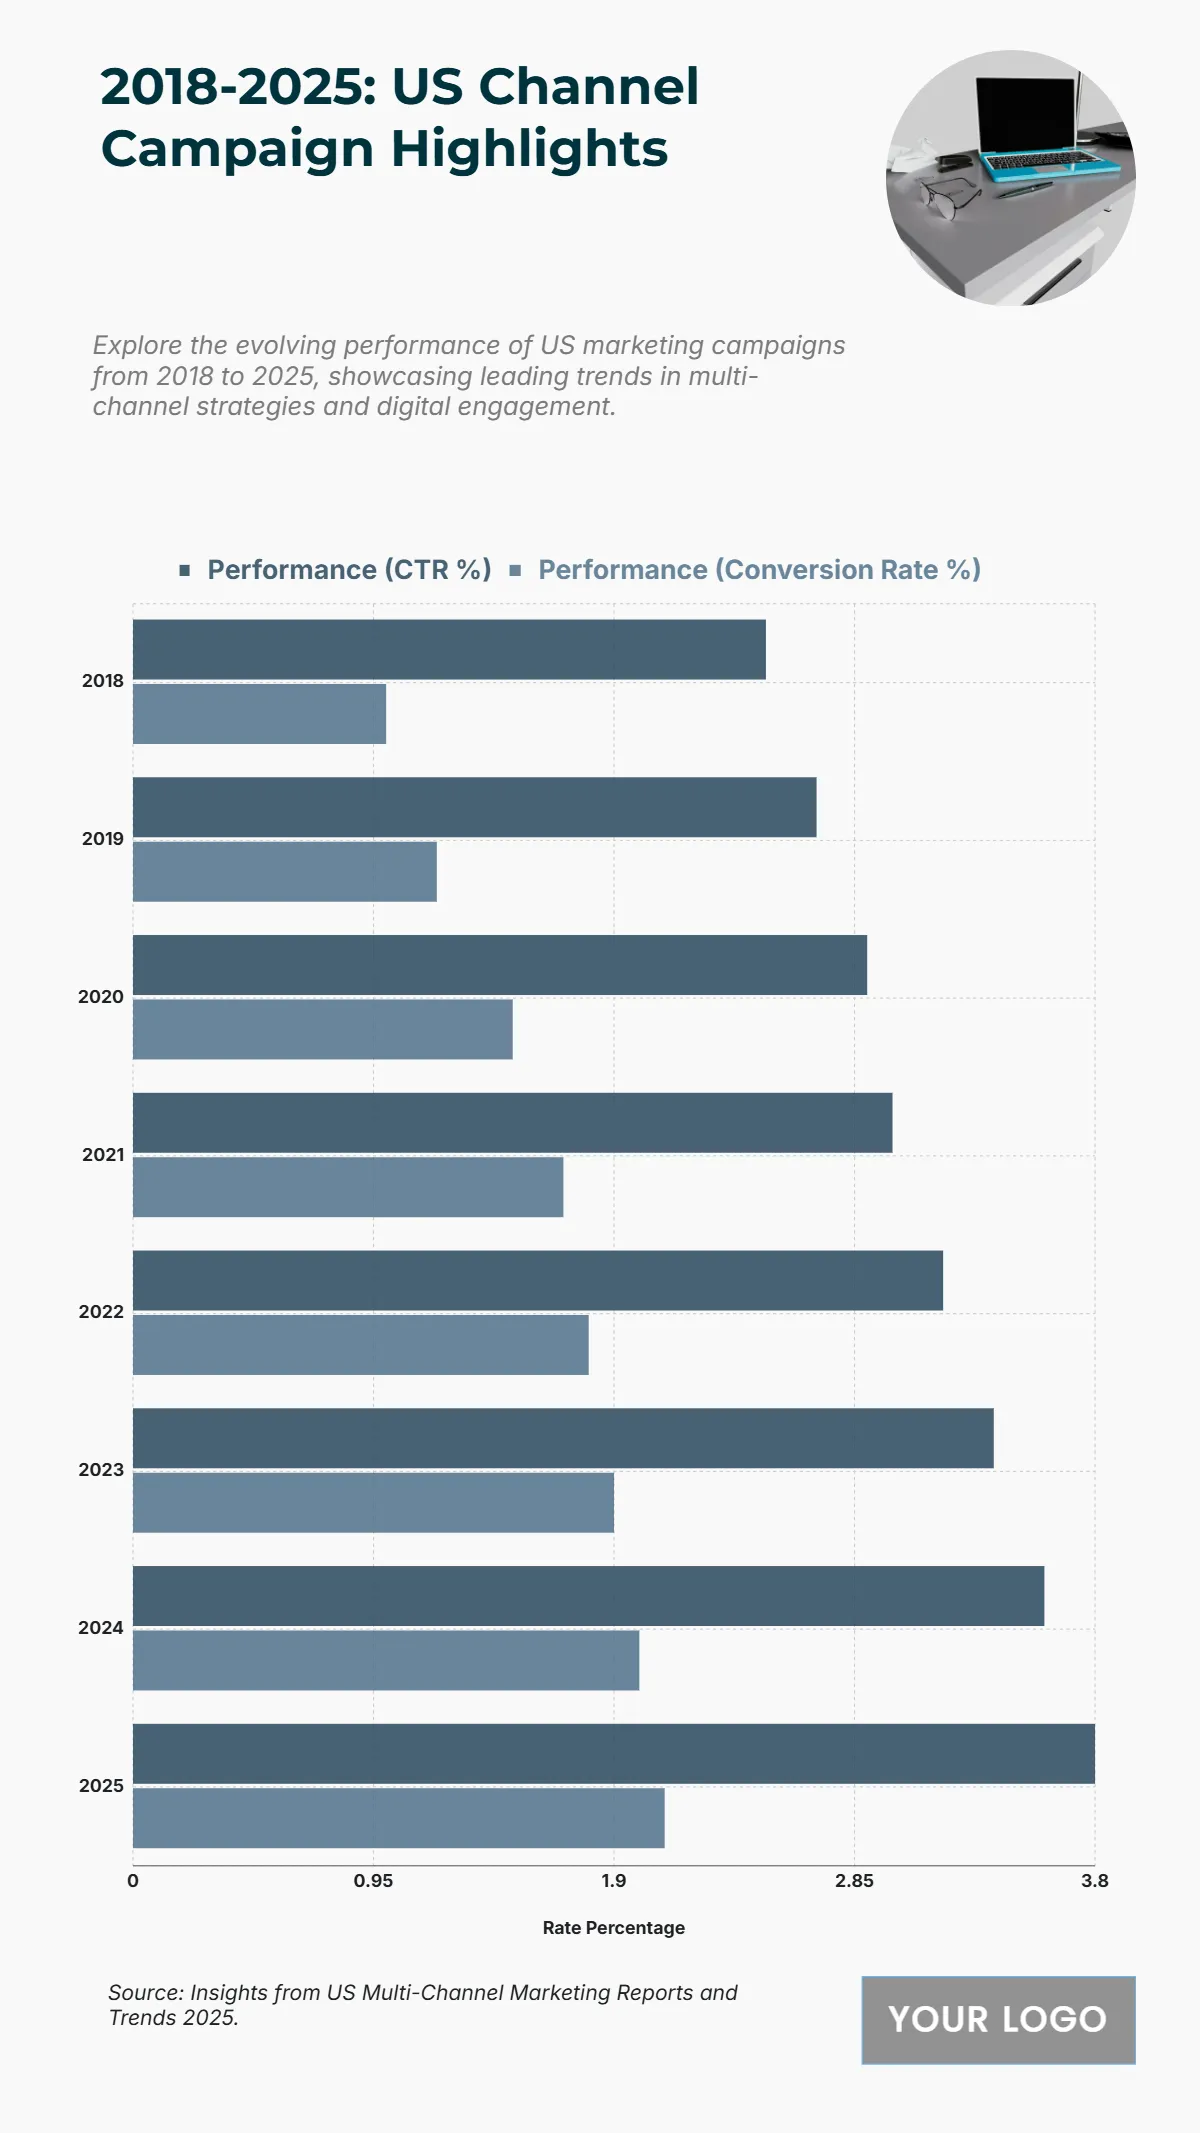
Free US Cross-Channel Campaign Performance Comparison from 2018 to 2025 Chart
The chart illustrates the improving performance of U.S. cross-channel marketing campaigns from 2018 to 2025, highlighting steady gains in both click-through rates (CTR) and conversion rates. In 2018, CTR started at 2.5% with a 1% conversion rate, showing early-stage cross-channel optimization. The metrics rose gradually to 2.7% CTR and 1.2% conversion in 2019, and 2.9% and 1.5% respectively in 2020. Continued growth was seen in 2021, reaching 3% CTR and 1.7% conversion, driven by integrated ad strategies and data-driven engagement. By 2023, performance climbed to 3.4% CTR and 1.9% conversion, then to 3.6% and 2% in 2024, signaling mature adoption of multi-channel marketing automation. The highest results are projected for 2025, with 3.8% CTR and 2.1% conversion rate, demonstrating improved targeting, personalization, and cohesive campaign management across digital platforms for enhanced marketing efficiency and audience reach.
| Labels | Performance (CTR %) | Performance (Conversion Rate %) |
|---|---|---|
| 2018 | 2.5 | 1.0 |
| 2019 | 2.7 | 1.2 |
| 2020 | 2.9 | 1.5 |
| 2021 | 3.0 | 1.7 |
| 2022 | 3.2 | 1.8 |
| 2023 | 3.4 | 1.9 |
| 2024 | 3.6 | 2.0 |
| 2025 | 3.8 | 2.1 |


