Free US Shopping Cart Abandonment Rate Trends from 2015 to 2025 Chart
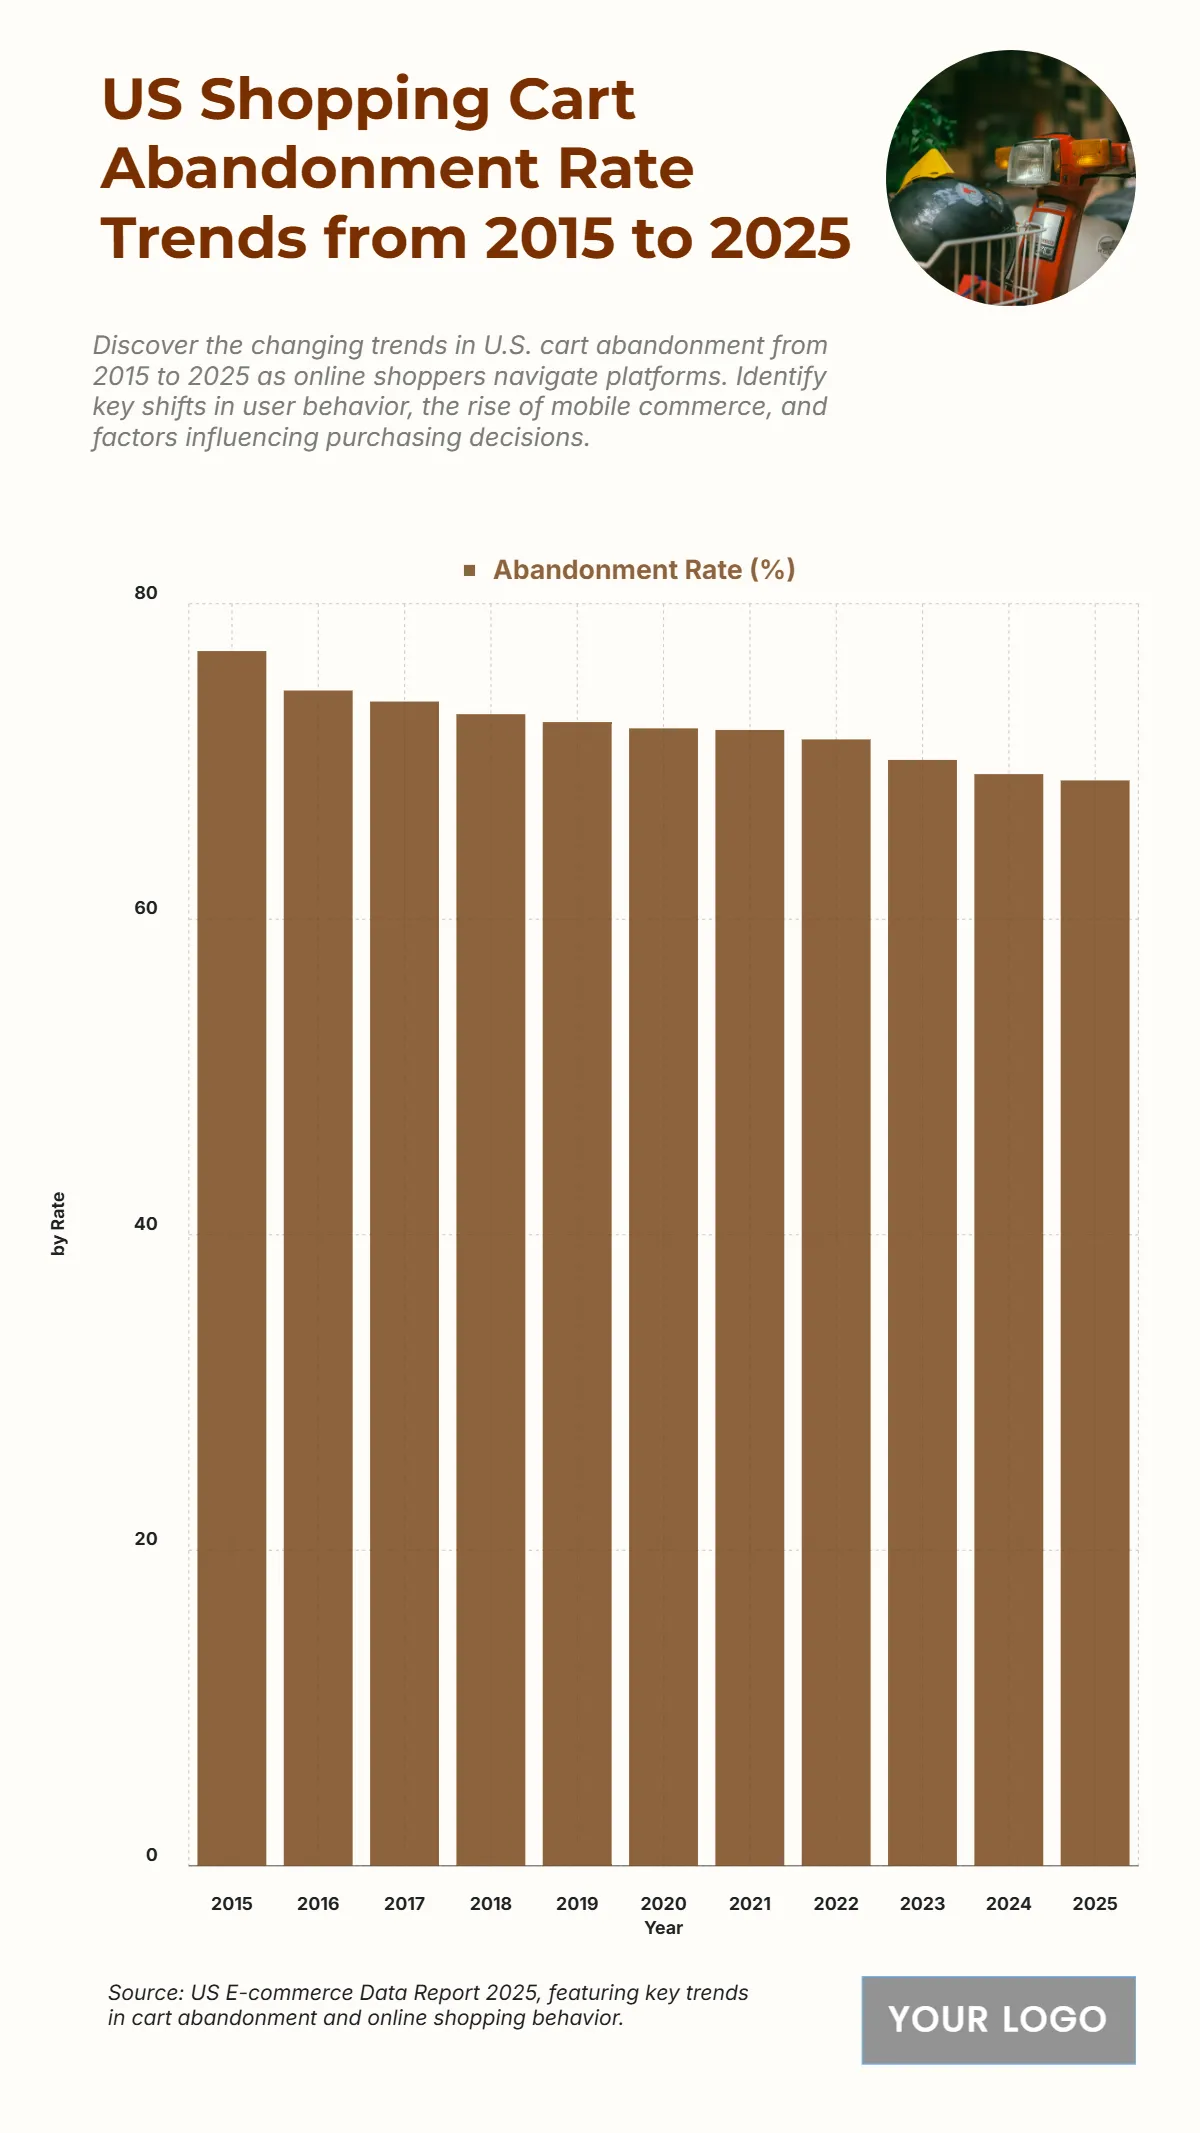
The chart highlights the gradual decline in the U.S. shopping cart abandonment rate from 2015 to 2025, reflecting improved checkout systems, enhanced user experience, and evolving consumer trust in e-commerce. In 2015, the abandonment rate was 77%, indicating a high percentage of users leaving carts without completing purchases. The rate slightly decreased to 74.5% in 2016, 73.8% in 2017, and 73% in 2018. A more noticeable improvement appeared in 2019 at 72.5% and 72.1% in 2020, as mobile-optimized sites and better payment integrations emerged. The downward trend continued with 72% in 2021, 71.4% in 2022, and 70.1% in 2023. By 2024, the rate declined further to 69.2%, reaching 68.8% in 2025, its lowest point of the decade. This consistent reduction underscores the success of e-commerce advancements, including faster payment gateways, trust signals, and seamless omnichannel shopping experiences.
| Labels | Abandonment Rate (%) |
|---|---|
| 2015 | 77.0 |
| 2016 | 74.5 |
| 2017 | 73.8 |
| 2018 | 73.0 |
| 2019 | 72.5 |
| 2020 | 72.1 |
| 2021 | 72.0 |
| 2022 | 71.4 |
| 2023 | 70.1 |
| 2024 | 69.2 |
| 2025 | 68.8 |


