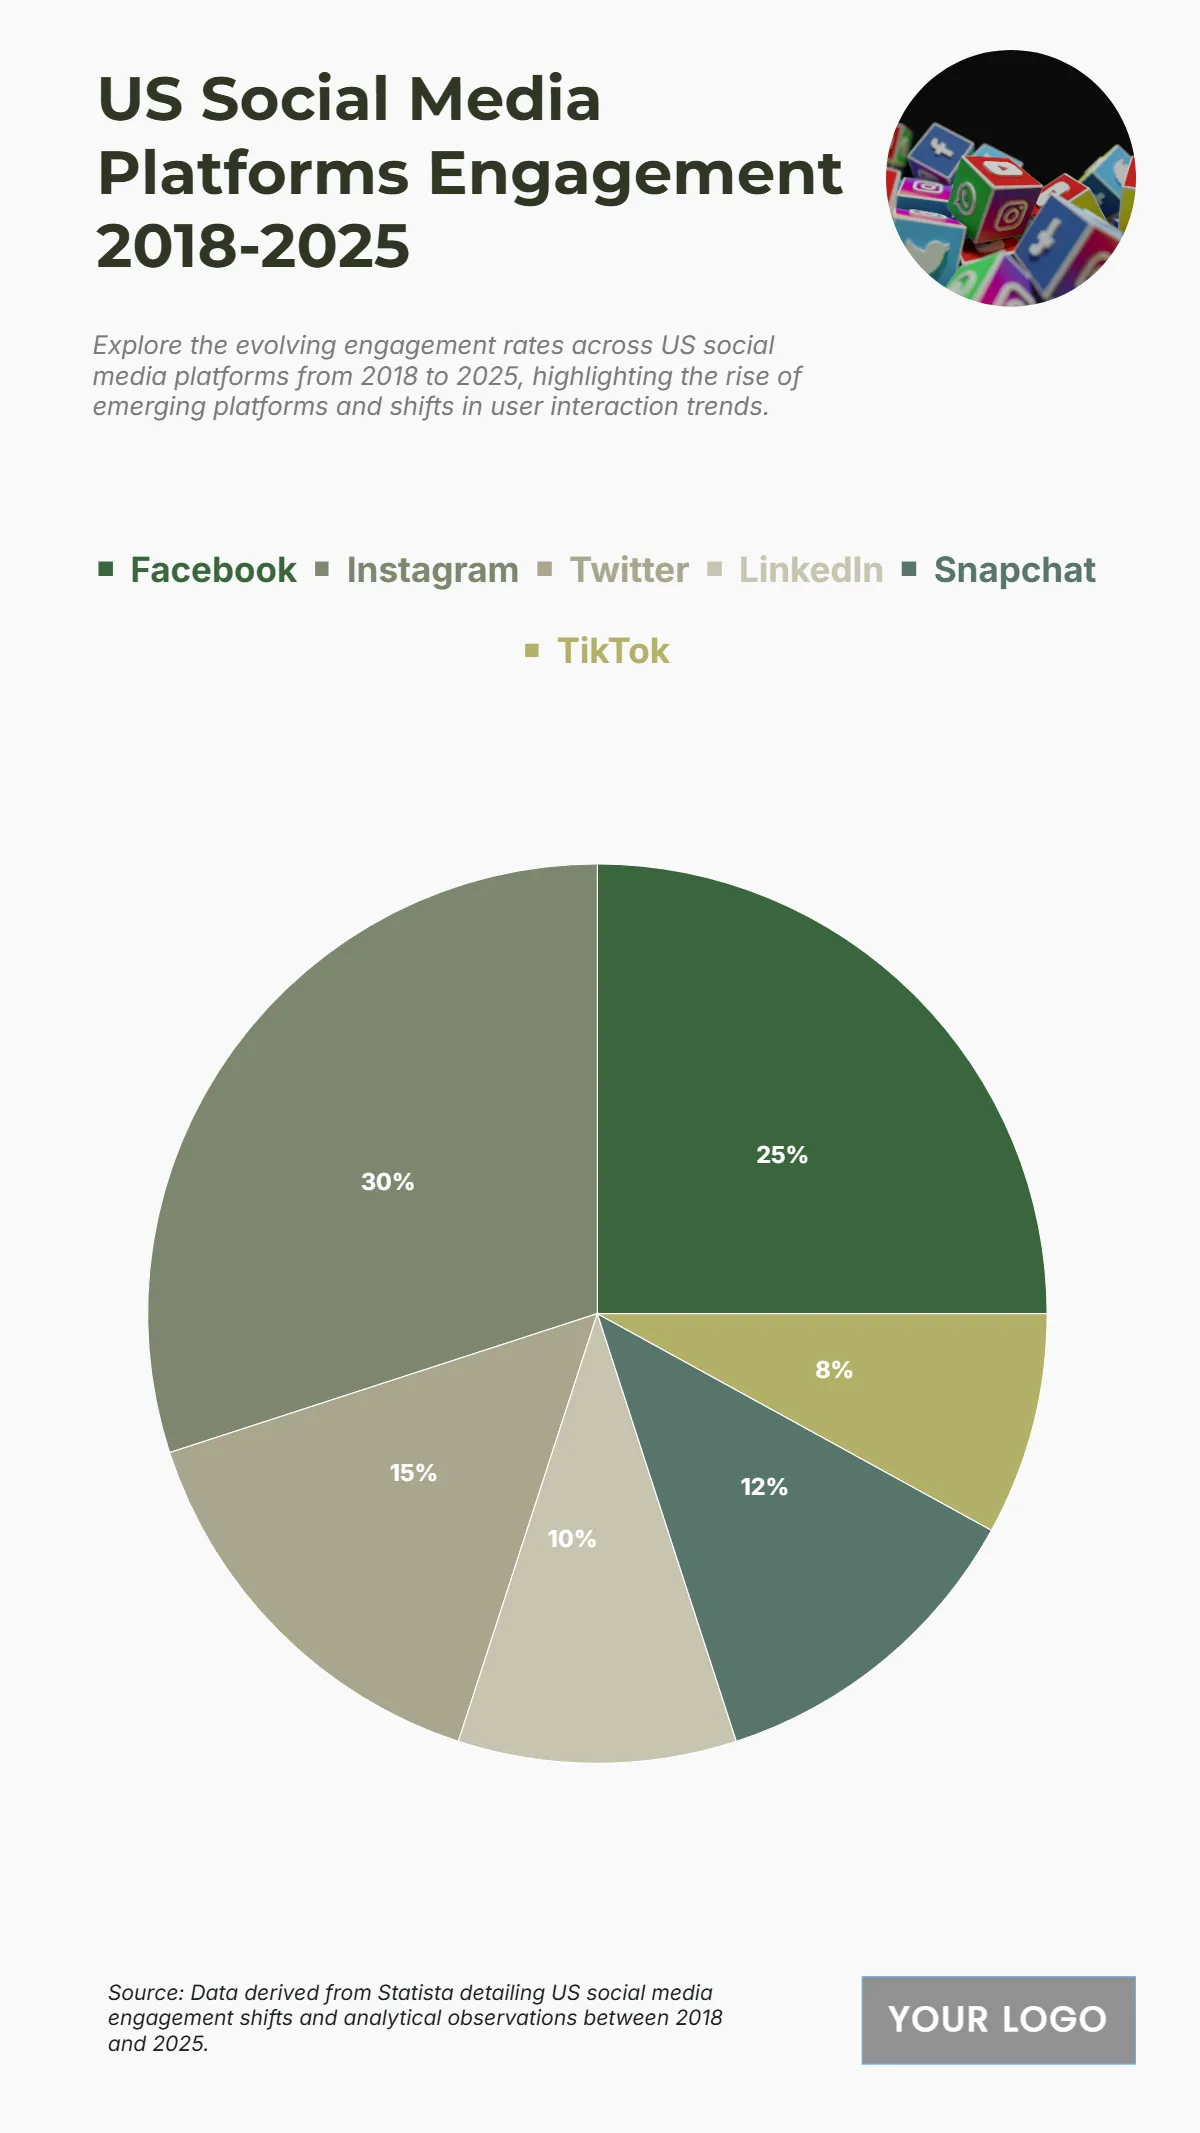
Free US Social Media Engagement Rate by Platform from 2018 to 2025 Chart
The chart highlights the engagement distribution among major U.S. social media platforms from 2018 to 2025, emphasizing shifting user interaction patterns. Instagram leads with the highest total engagement rate of 30%, driven by its visual-first content strategy and influencer-based marketing dominance. Facebook follows closely at 25%, maintaining a strong presence through diversified audience demographics and advertising reach. Twitter holds 15%, supported by real-time communication and trending topic engagement. Snapchat secures 12%, reflecting steady engagement from younger demographics through interactive and AR features. LinkedIn, with 10%, continues to grow within professional networking and B2B marketing circles. Lastly, TikTok, despite being a newer entrant, captures 8%, demonstrating rapid adoption and growing influence through short-form video content. The data underscores a fragmented but dynamic social media landscape where video-centric and visual engagement platforms continue to outperform traditional text-driven networks in user activity and brand interaction.
| Labels | 2018–2025 Total Engagement Rate (%) |
|---|---|
| 25 | |
| 30 | |
| 15 | |
| 10 | |
| Snapchat | 12 |
| TikTok | 8 |


