Free US Video Advertising Revenue Growth from 2015 to 2025 Chart
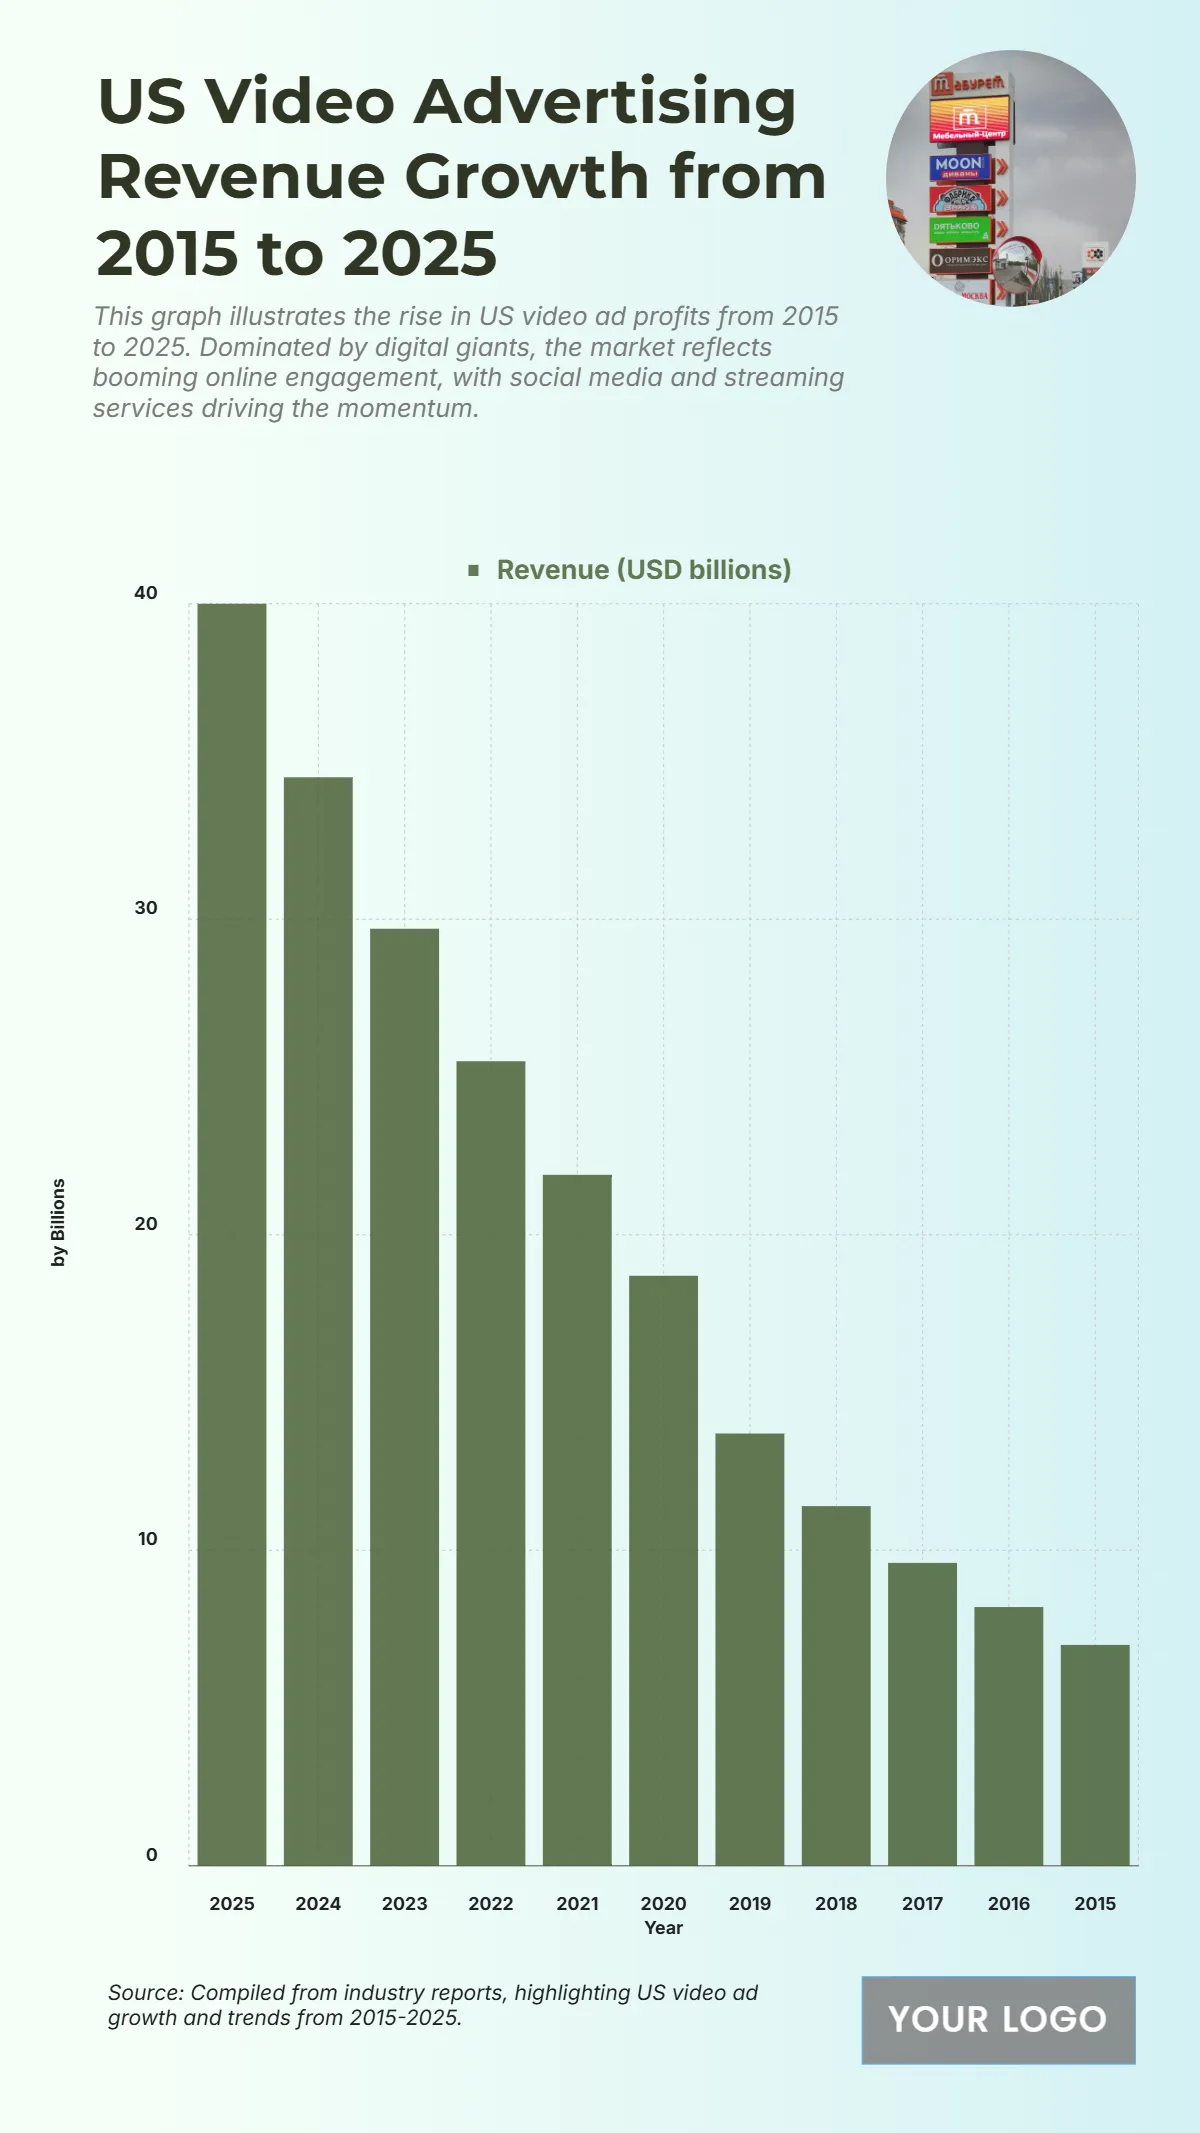
The chart showcases the consistent and robust increase in U.S. video advertising revenue between 2015 and 2025, driven by the surge of digital streaming, social media engagement, and the dominance of online platforms like YouTube and TikTok. The total revenue grows steadily from $7 billion in 2015 to a projected $40 billion in 2025, marking a more than fivefold increase over the decade. Early growth years saw modest rises, with $8.2 billion in 2016, $9.6 billion in 2017, and $11.4 billion in 2018, accelerating in later years due to digital transformation and increased mobile consumption. By 2019, revenue climbed to $13.7 billion, then surged to $18.7 billion in 2020 and $21.9 billion in 2021 as online video became central to marketing. The trend continued upward with $25.5 billion in 2022, $29.7 billion in 2023, and $34.5 billion in 2024, peaking at $40 billion in 2025, reflecting a rapidly evolving and highly profitable ad landscape.
| Labels | Revenue (USD billions) |
|---|---|
| 2025 | 40.0 |
| 2024 | 34.5 |
| 2023 | 29.7 |
| 2022 | 25.5 |
| 2021 | 21.9 |
| 2020 | 18.7 |
| 2019 | 13.7 |
| 2018 | 11.4 |
| 2017 | 9.6 |
| 2016 | 8.2 |
| 2015 | 7.0 |


