Free US Consumer Confidence Index by State from 2015 to 2025 Chart
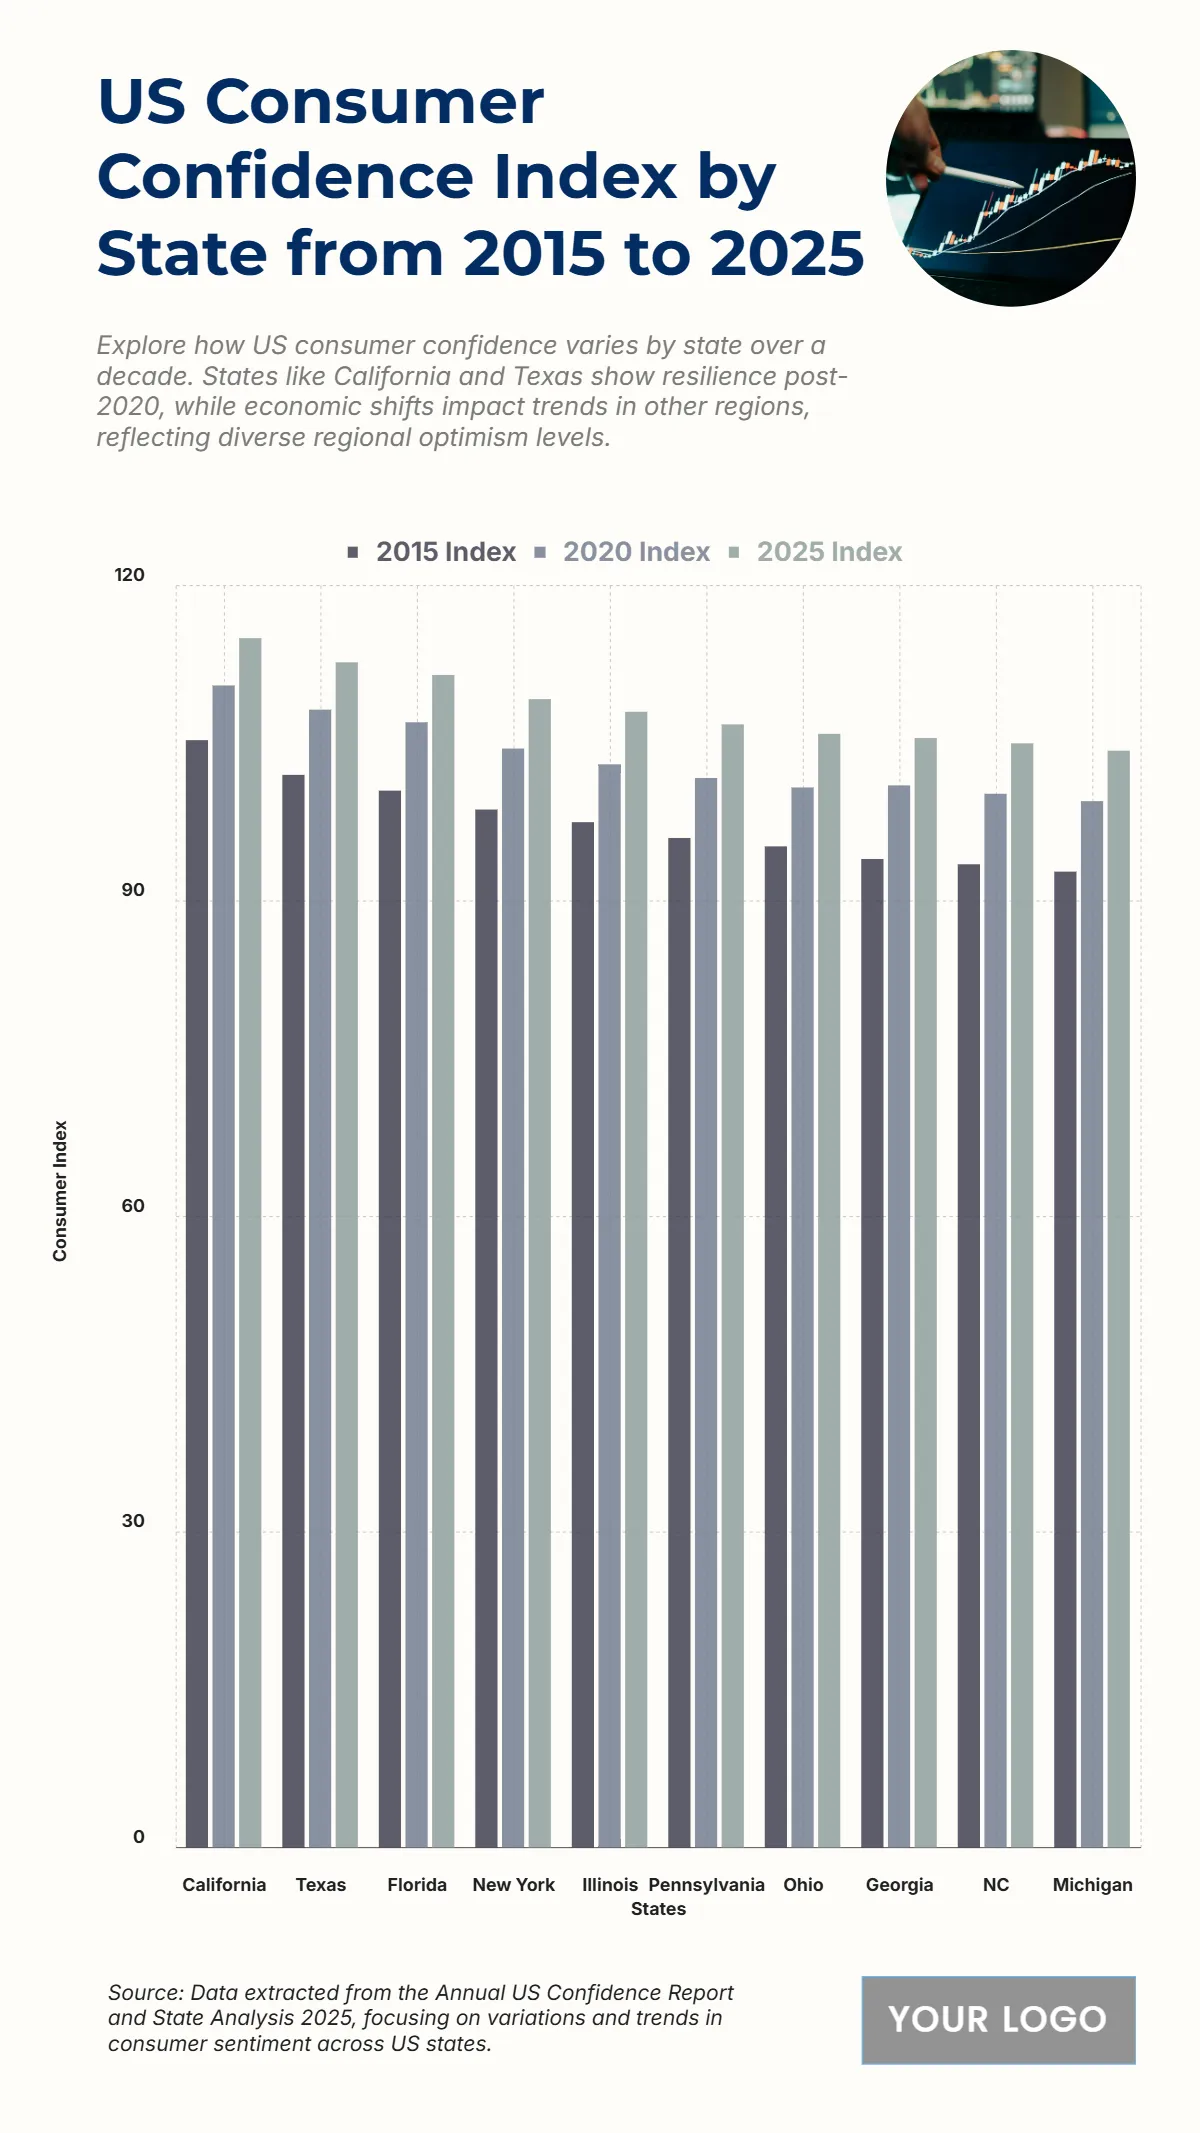
The chart illustrates the varying levels of U.S. Consumer Confidence Index across major states from 2015 to 2025, showing a steady upward trend that reflects improving economic sentiment and resilience over the decade. California consistently leads, rising from 105.3 in 2015 to 115 by 2025, driven by its robust economy and innovation sectors. Texas follows, increasing from 102 to 112.7, while Florida shows similar optimism, climbing from 100.5 to 111.5. New York records substantial growth, moving from 98.7 to 109.2, and Illinois advances from 97.5 to 108. Other states like Pennsylvania (96 to 106.8), Ohio (95.2 to 105.9), Georgia (94 to 105.5), North Carolina (93.5 to 105), and Michigan (92.8 to 104.3) also display steady confidence gains. Overall, the chart indicates broad consumer optimism across all regions, highlighting economic recovery, strong job markets, and growing stability leading into 2025.
| Labels | 2015 Index | 2020 Index | 2025 Index |
|---|---|---|---|
| California | 105.3 | 110.5 | 115 |
| Texas | 102 | 108.2 | 112.7 |
| Florida | 100.5 | 107 | 111.5 |
| New York | 98.7 | 104.5 | 109.2 |
| Illinois | 97.5 | 103 | 108 |
| Pennsylvania | 96 | 101.7 | 106.8 |
| Ohio | 95.2 | 100.8 | 105.9 |
| Georgia | 94 | 101 | 105.5 |
| NC | 93.5 | 100.2 | 105 |
| Michigan | 92.8 | 99.5 | 104.3 |


