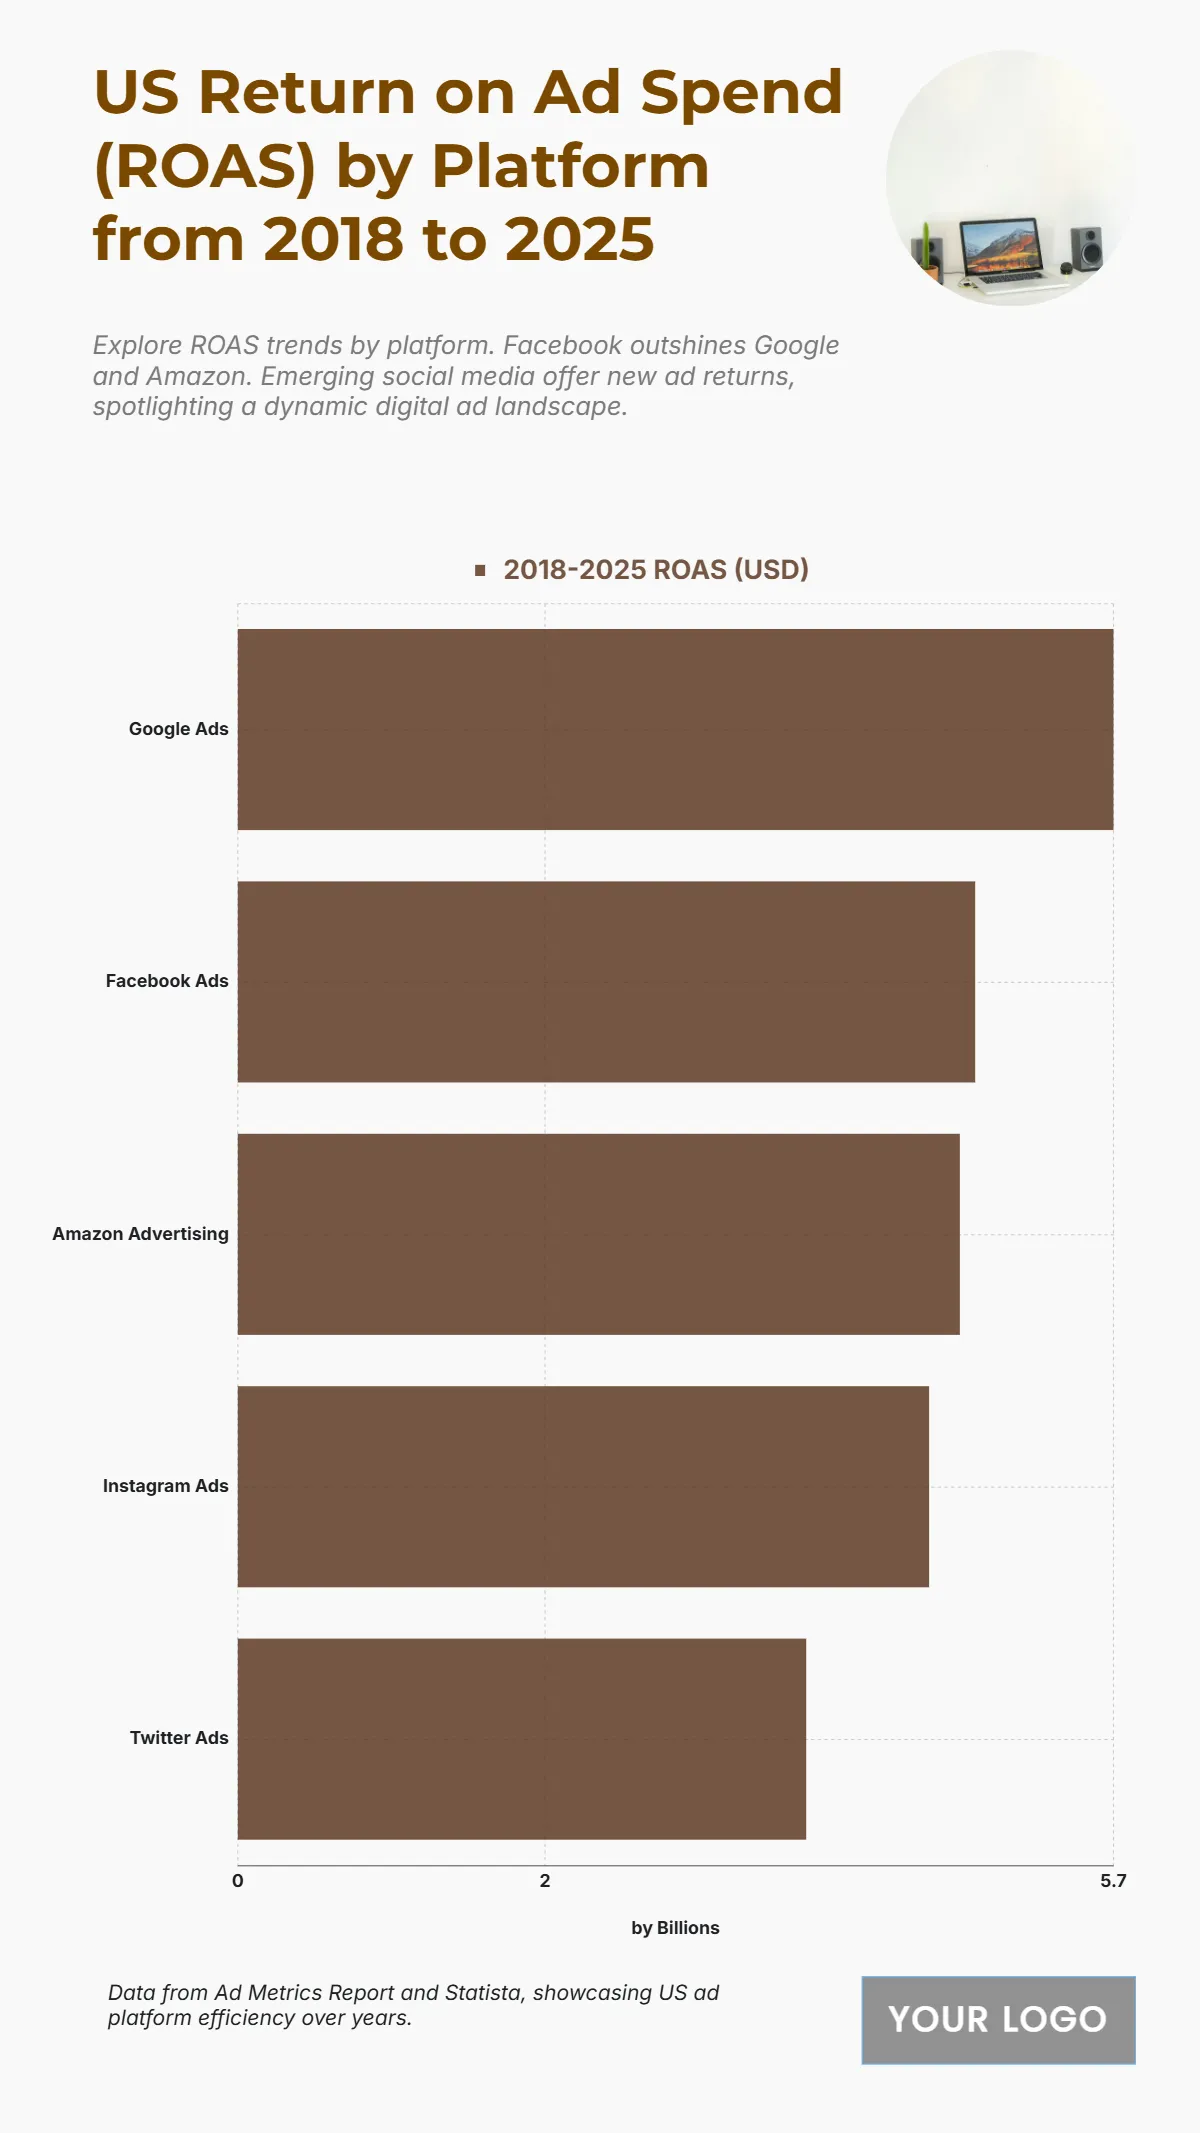
Free US Return on Ad Spend (ROAS) by Platform from 2018 to 2025 Chart
The chart highlights the comparative Return on Ad Spend (ROAS) performance among major U.S. advertising platforms from 2018 to 2025, showcasing which channels deliver the highest returns per advertising dollar spent. Google Ads leads with a ROAS of $5.7, indicating its unmatched efficiency in generating revenue through targeted search and display campaigns. Facebook Ads follows closely at $4.8, reflecting strong engagement and conversion potential through social media marketing. Amazon Advertising ranks third at $4.7, driven by its commerce-focused audience and purchase intent advantage. Instagram Ads, backed by Meta’s ecosystem, achieves $4.5, maintaining competitive performance through visual engagement and influencer integration. Lastly, Twitter Ads records a $3.7 ROAS, marking lower but steady returns amid a more niche advertising audience. Overall, the chart emphasizes Google’s dominance in ad efficiency, while Meta’s platforms—Facebook and Instagram—continue to deliver significant returns across social-driven campaigns.
| Labels | 2018–2025 ROAS (USD) |
|---|---|
| Google Ads | 5.7 |
| Facebook Ads | 4.8 |
| Amazon Advertising | 4.7 |
| Instagram Ads | 4.5 |
| Twitter Ads | 3.7 |


