Free US Marketing Budget Allocation by Channel from 2018 to 2025 Chart
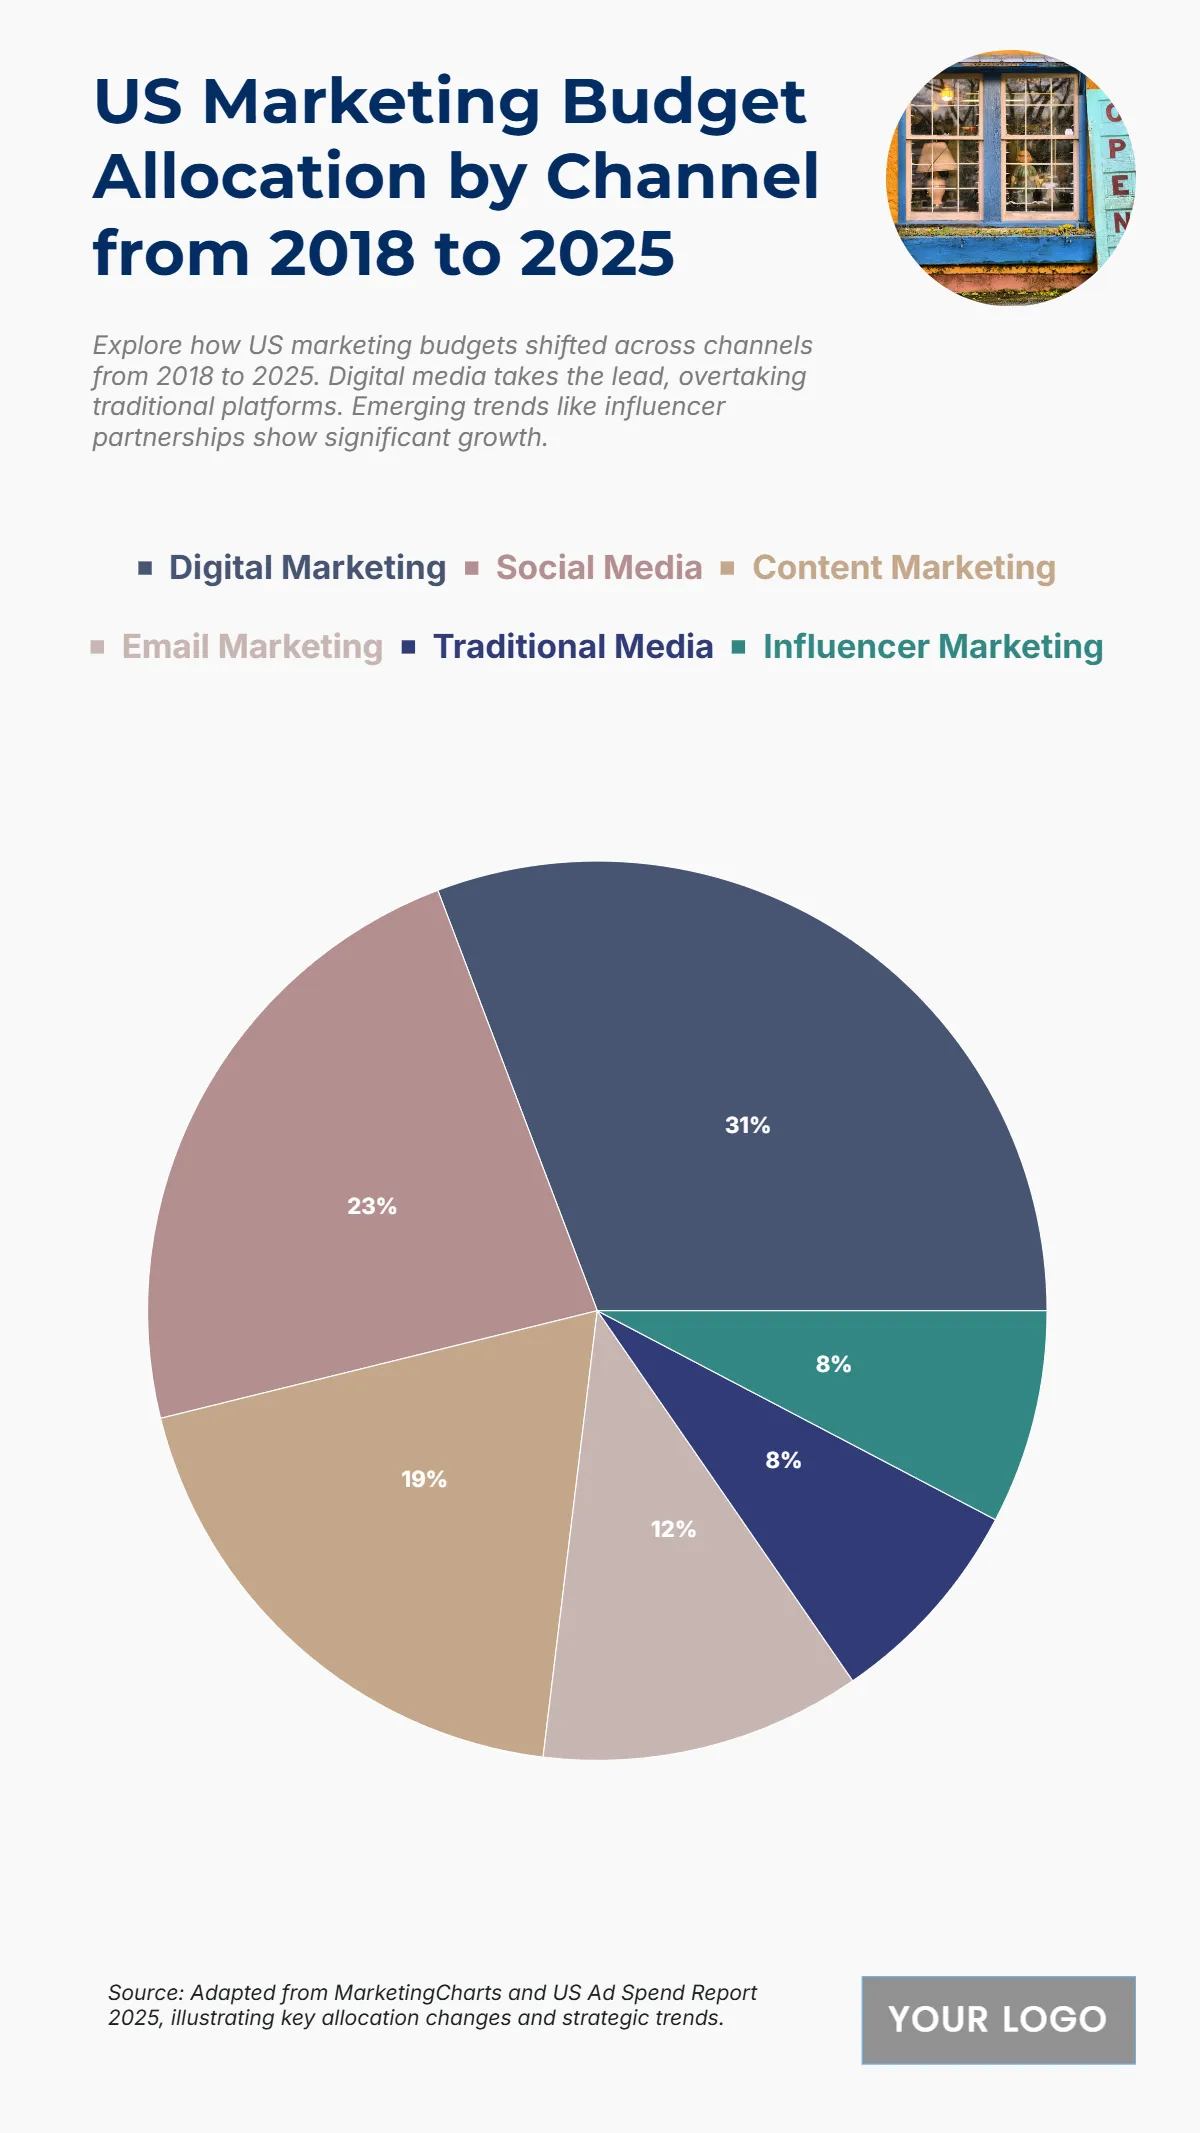
The chart illustrates how marketing budgets in the U.S. are distributed across different channels between 2018 and 2025, emphasizing the dominance of digital and social-driven strategies. Digital Marketing leads with the highest allocation of $40 billion, reflecting brands’ strong investment in online visibility and data-driven advertising. Social Media follows at $30 billion, showcasing its continued influence on audience engagement and brand reach. Content Marketing accounts for $25 billion, highlighting the growing importance of storytelling and organic brand communication. Meanwhile, Email Marketing receives $15 billion, maintaining relevance as a cost-effective customer retention tool. Both Traditional Media and Influencer Marketing secure $10 billion each, signaling a balanced shift where traditional methods coexist with new-age influencer collaborations. Overall, the data reveals a strategic transformation toward digital ecosystems, as businesses prioritize online interaction, performance analytics, and personalized communication to maximize marketing efficiency.
| Labels | 2018–2025 Total Budget (Billions) |
|---|---|
| Digital Marketing | 40 |
| Social Media | 30 |
| Content Marketing | 25 |
| Email Marketing | 15 |
| Traditional Media | 10 |
| Influencer Marketing | 10 |


