Free US Social Media Advertising Reach by Age Group from 2018 to 2025 Chart
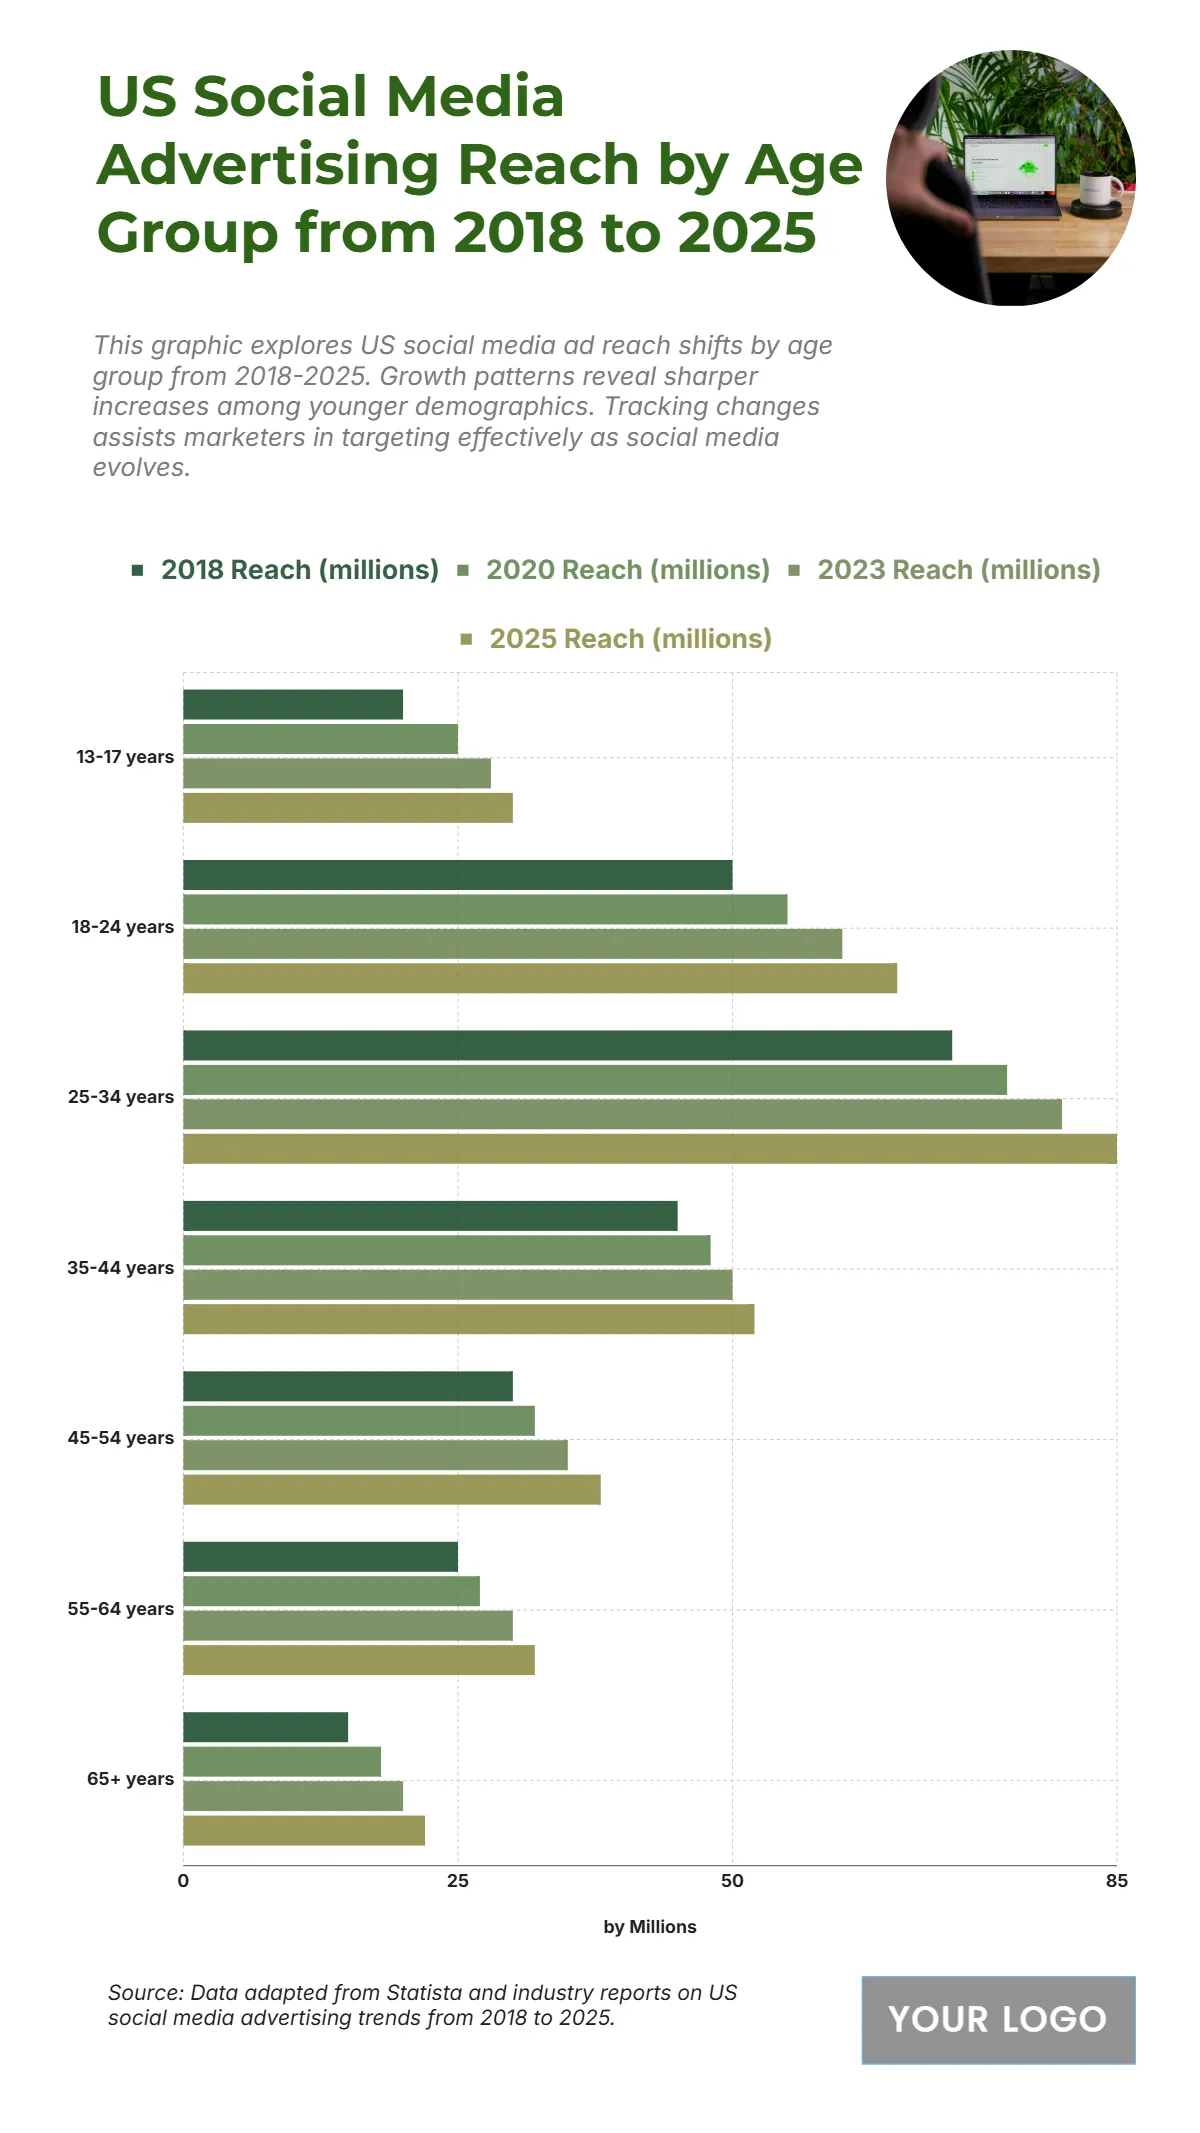
The chart shows the growth in U.S. social media advertising reach by age group from 2018 to 2025, emphasizing a steady increase across all demographics, with younger users leading engagement. The 25–34 age group dominates throughout the period, rising from 70 million in 2018 to 85 million in 2025, underscoring its strong influence on social media platforms. The 18–24 group follows closely, expanding from 50 million to 65 million, reflecting growing digital engagement among younger adults. The 35–44 segment rises moderately from 45 million to 52 million, while the 45–54 group grows from 30 million to 38 million. Older demographics show gradual adoption, with the 55–64 group increasing from 25 million to 32 million, and the 65+ group from 15 million to 22 million. The 13–17 age range also climbs from 20 million to 30 million, highlighting ongoing digital immersion among Gen Z users.
| Labels | 2018 Reach (millions) | 2020 Reach (millions) | 2023 Reach (millions) | 2025 Reach (millions) |
|---|---|---|---|---|
| 13–17 years | 20 | 25 | 28 | 30 |
| 18–24 years | 50 | 55 | 60 | 65 |
| 25–34 years | 70 | 75 | 80 | 85 |
| 35–44 years | 45 | 48 | 50 | 52 |
| 45–54 years | 30 | 32 | 35 | 38 |
| 55–64 years | 25 | 27 | 30 | 32 |
| 65+ years | 15 | 18 | 20 | 22 |


