Free US Online Retail Conversion Rate Trends from 2015 to 2025 Chart
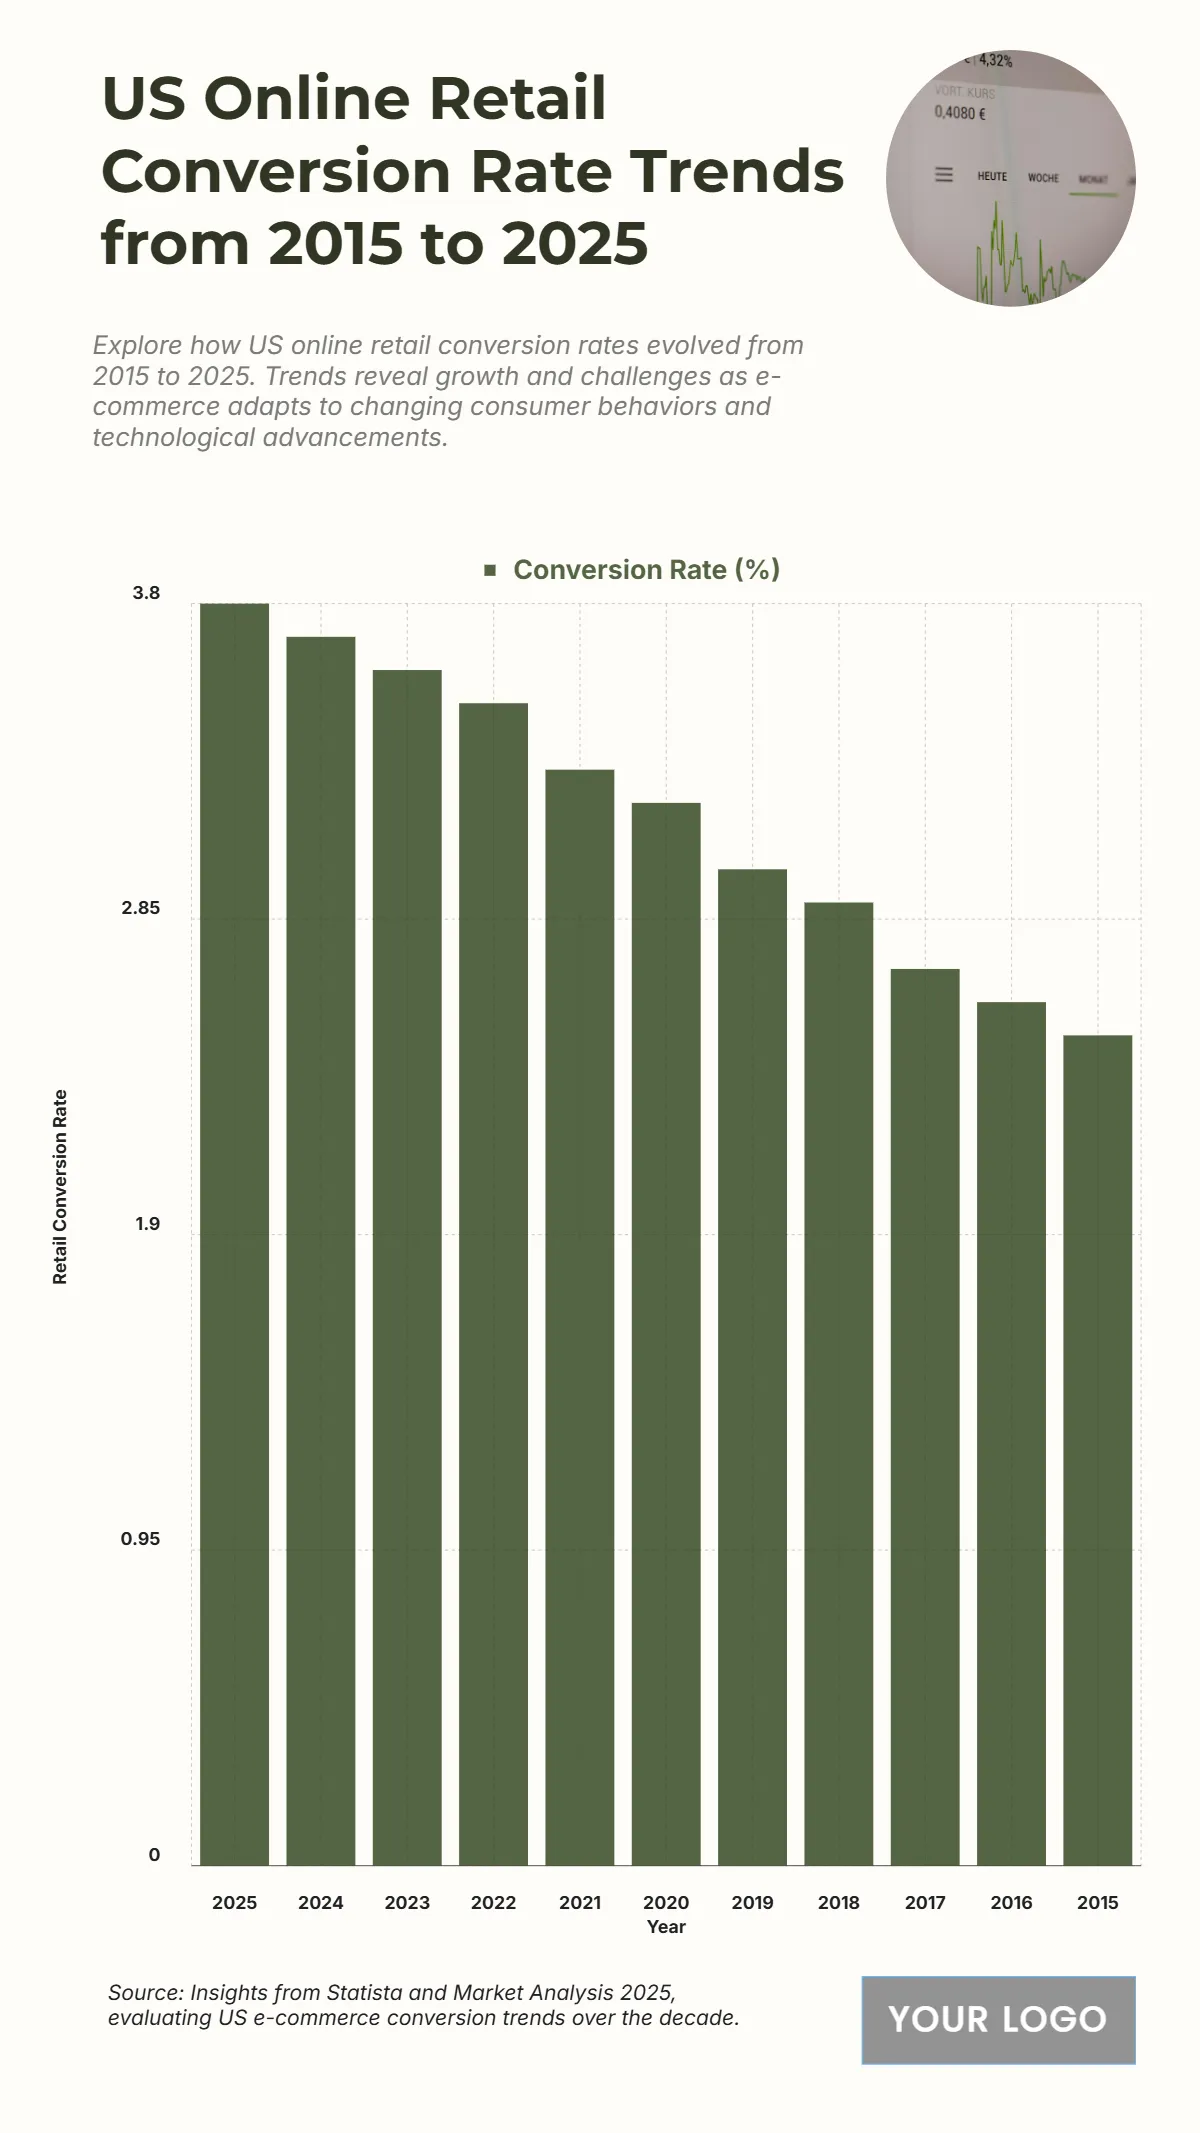
The chart highlights the steady improvement in the U.S. online retail conversion rate from 2015 to 2025, reflecting the evolution of e-commerce performance amid shifting consumer behaviors and technological advances. The conversion rate rises from 2.5% in 2015 to 3.8% in 2025, marking a decade of consistent digital growth. Between 2015 and 2018, the rate increased moderately from 2.5% to 2.9%, signaling gradual optimization in online shopping platforms. From 2019 onward, e-commerce efficiency surged as the conversion rate reached 3.2% in 2020 and 3.5% by 2022, supported by improved user experience, personalized marketing, and pandemic-driven digital adoption. The upward trajectory continues through 2023 (3.6%), 2024 (3.7%), and 2025 (3.8%), indicating sustained consumer trust and better checkout processes. Overall, the chart underscores how advancements in analytics, automation, and mobile commerce have strengthened conversion performance across the online retail landscape.
| Labels | Conversion Rate (%) |
|---|---|
| 2025 | 3.8 |
| 2024 | 3.7 |
| 2023 | 3.6 |
| 2022 | 3.5 |
| 2021 | 3.3 |
| 2020 | 3.2 |
| 2019 | 3.0 |
| 2018 | 2.9 |
| 2017 | 2.7 |
| 2016 | 2.6 |
| 2015 | 2.5 |


