Free US B2B Digital Marketing Spend by Industry from 2015 to 2025 Chart
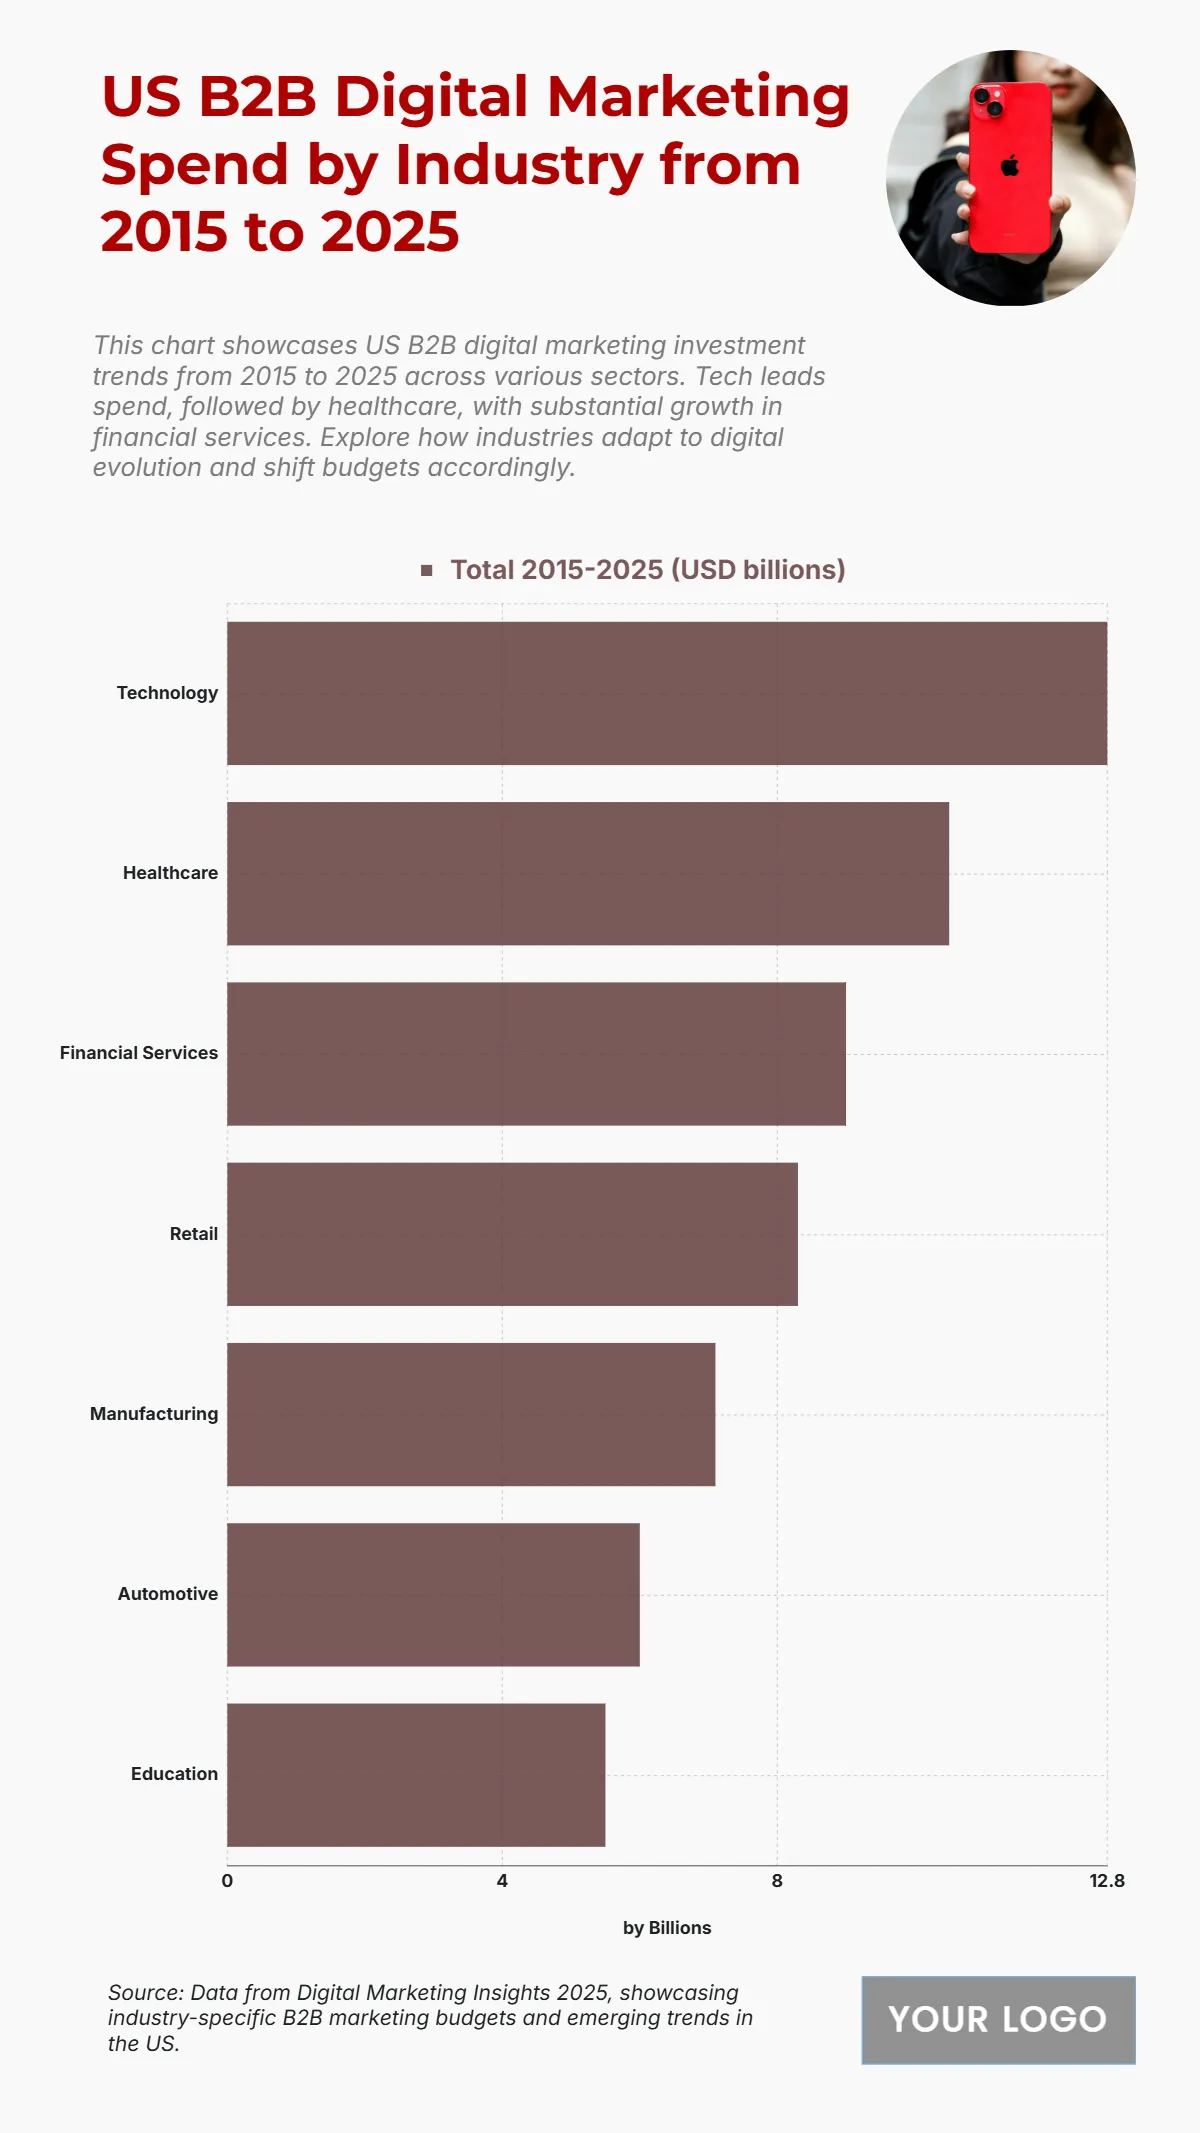
The chart highlights the distribution of U.S. B2B digital marketing spending by industry from 2015 to 2025, emphasizing how technology and healthcare dominate investment trends. The technology sector leads all industries with a total spend of $12.8 billion, reflecting its continuous innovation and reliance on digital engagement strategies. Healthcare follows closely with $10.5 billion, showing strong adoption of online platforms for awareness and service promotion. Financial services secure $9 billion, driven by the sector’s need for trust-based digital communication and fintech expansion. Retail records $8.3 billion, underscoring the shift toward e-commerce and personalized marketing. Meanwhile, manufacturing invests $7.1 billion, showing progress in digital transformation, while automotive allocates $6 billion, and education rounds out the list with $5.5 billion, reflecting gradual but steady digital adaptation. Overall, the chart illustrates that all sectors have prioritized digital channels, with technology remaining at the forefront of marketing innovation and growth.
| Labels | Total 2015–2025 (USD billions) |
|---|---|
| Technology | 12.8 |
| Healthcare | 10.5 |
| Financial Services | 9.0 |
| Retail | 8.3 |
| Manufacturing | 7.1 |
| Automotive | 6.0 |
| Education | 5.5 |


