Free US Mobile App Marketing ROI by Category from 2018 to 2025 Chart
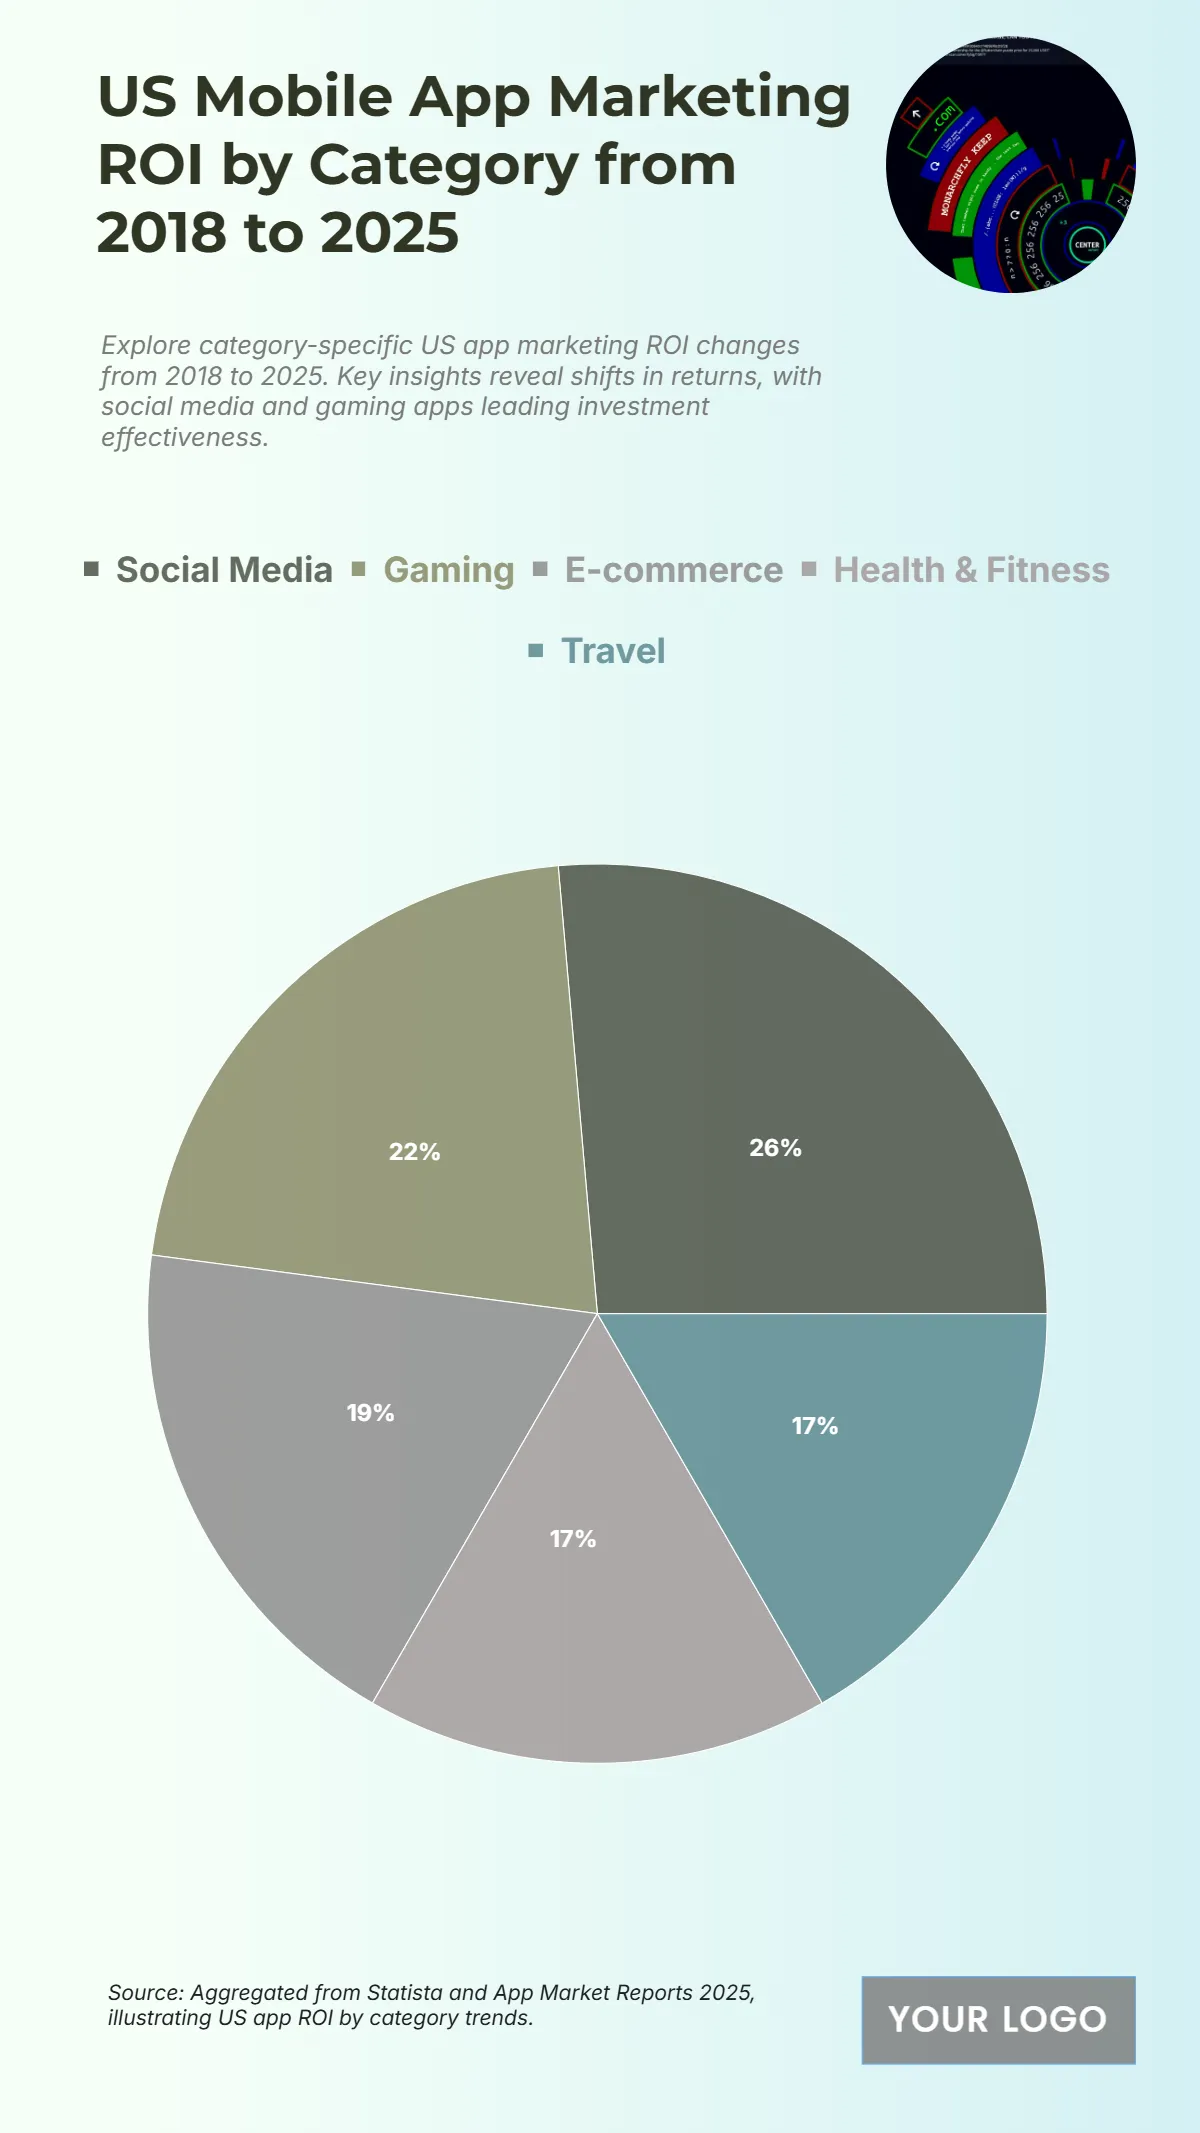
The chart showcases the return on investment (ROI) performance across U.S. mobile app marketing categories from 2018 to 2025, highlighting strong disparities among app types. Social media apps lead with an exceptional ROI of 190%, underscoring their dominance in ad engagement and monetization effectiveness. The gaming sector follows with a robust 155% ROI, supported by in-app purchases, user retention strategies, and evolving monetization models. E-commerce apps generate a 135% ROI, reflecting the consistent growth of online retail and digital shopping platforms. Both health & fitness and travel apps report equal ROIs of 120%, indicating stable but moderate returns as post-pandemic behavior and lifestyle apps sustain their relevance. Overall, the chart emphasizes how digital interactivity and social connectivity have made social media and gaming the most profitable app categories, shaping the mobile marketing landscape with higher engagement and conversion potential.
| Labels | ROI 2018–2025 (%) |
|---|---|
| Social Media | 190 |
| Gaming | 155 |
| E-commerce | 135 |
| Health & Fitness | 120 |
| Travel | 120 |


