Free US Online Ad Cost per Click (CPC) by Platform from 2015 to 2025 Chart
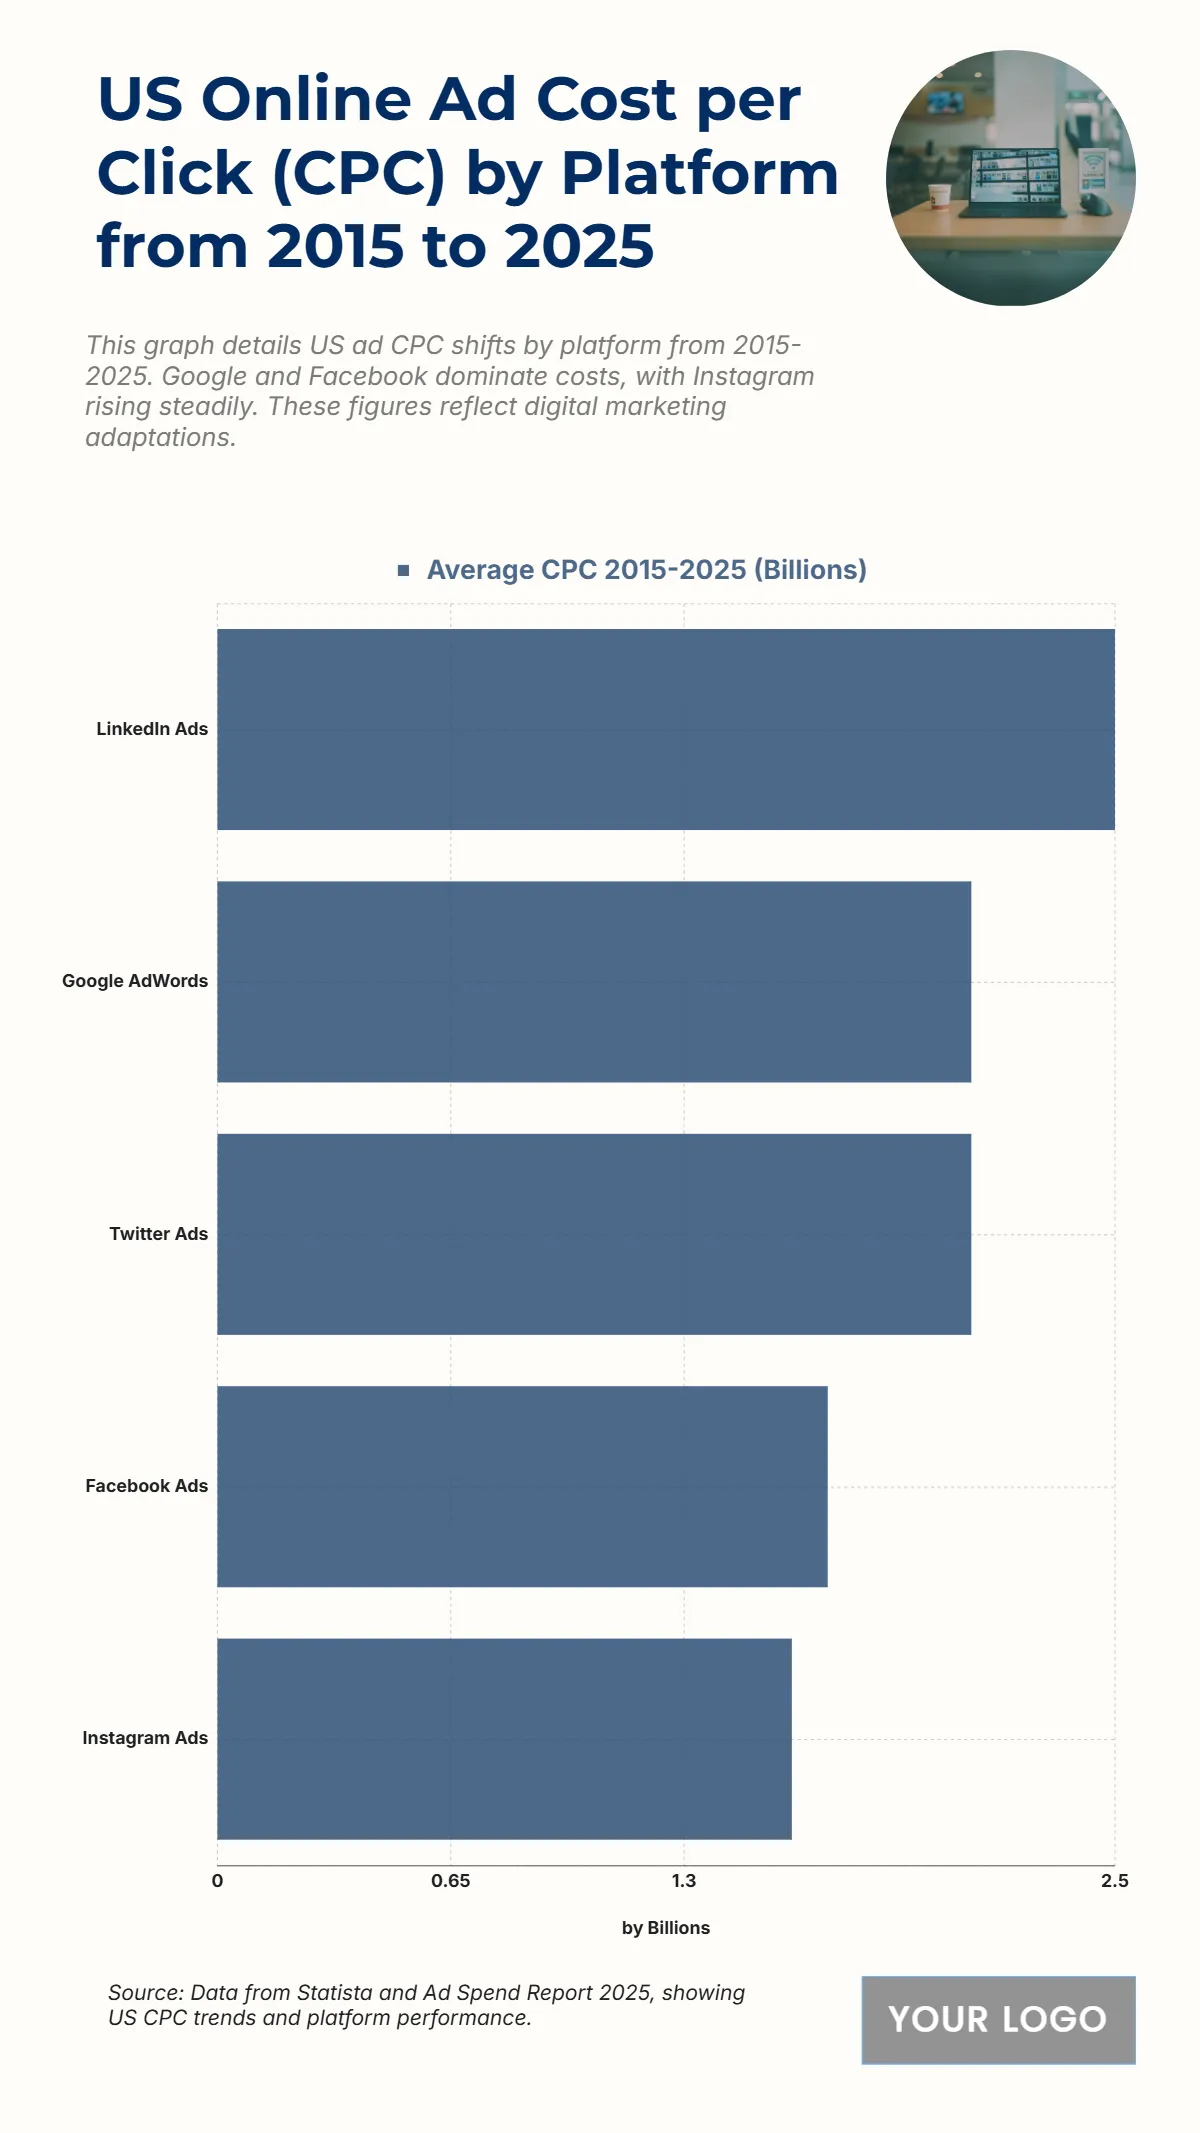
The chart illustrates the average cost per click (CPC) across major U.S. advertising platforms from 2015 to 2025, revealing significant variations in pricing among networks. LinkedIn Ads recorded the highest average CPC at $2.5 billion, reflecting its premium value for B2B marketing and professional targeting. Both Google AdWords and Twitter Ads follow closely, each averaging $2.1 billion, emphasizing their strong competition in digital ad placements and broad audience reach. Facebook Ads come next with an average CPC of $1.7 billion, driven by its massive user base and precision targeting capabilities, while Instagram Ads trail slightly at $1.6 billion, yet show continuous growth due to visual engagement and influencer marketing trends. Overall, the chart demonstrates that professional and search-based ad platforms dominate in cost, as advertisers continue to invest heavily in high-intent audiences and measurable engagement performance.
| Labels | Average CPC 2015–2025 (Billions) |
|---|---|
| LinkedIn Ads | 2.5 |
| Google AdWords | 2.1 |
| Twitter Ads | 2.1 |
| Facebook Ads | 1.7 |
| Instagram Ads | 1.6 |


