Free US Retail Website Traffic Share by Device from 2020 to 2025 Chart
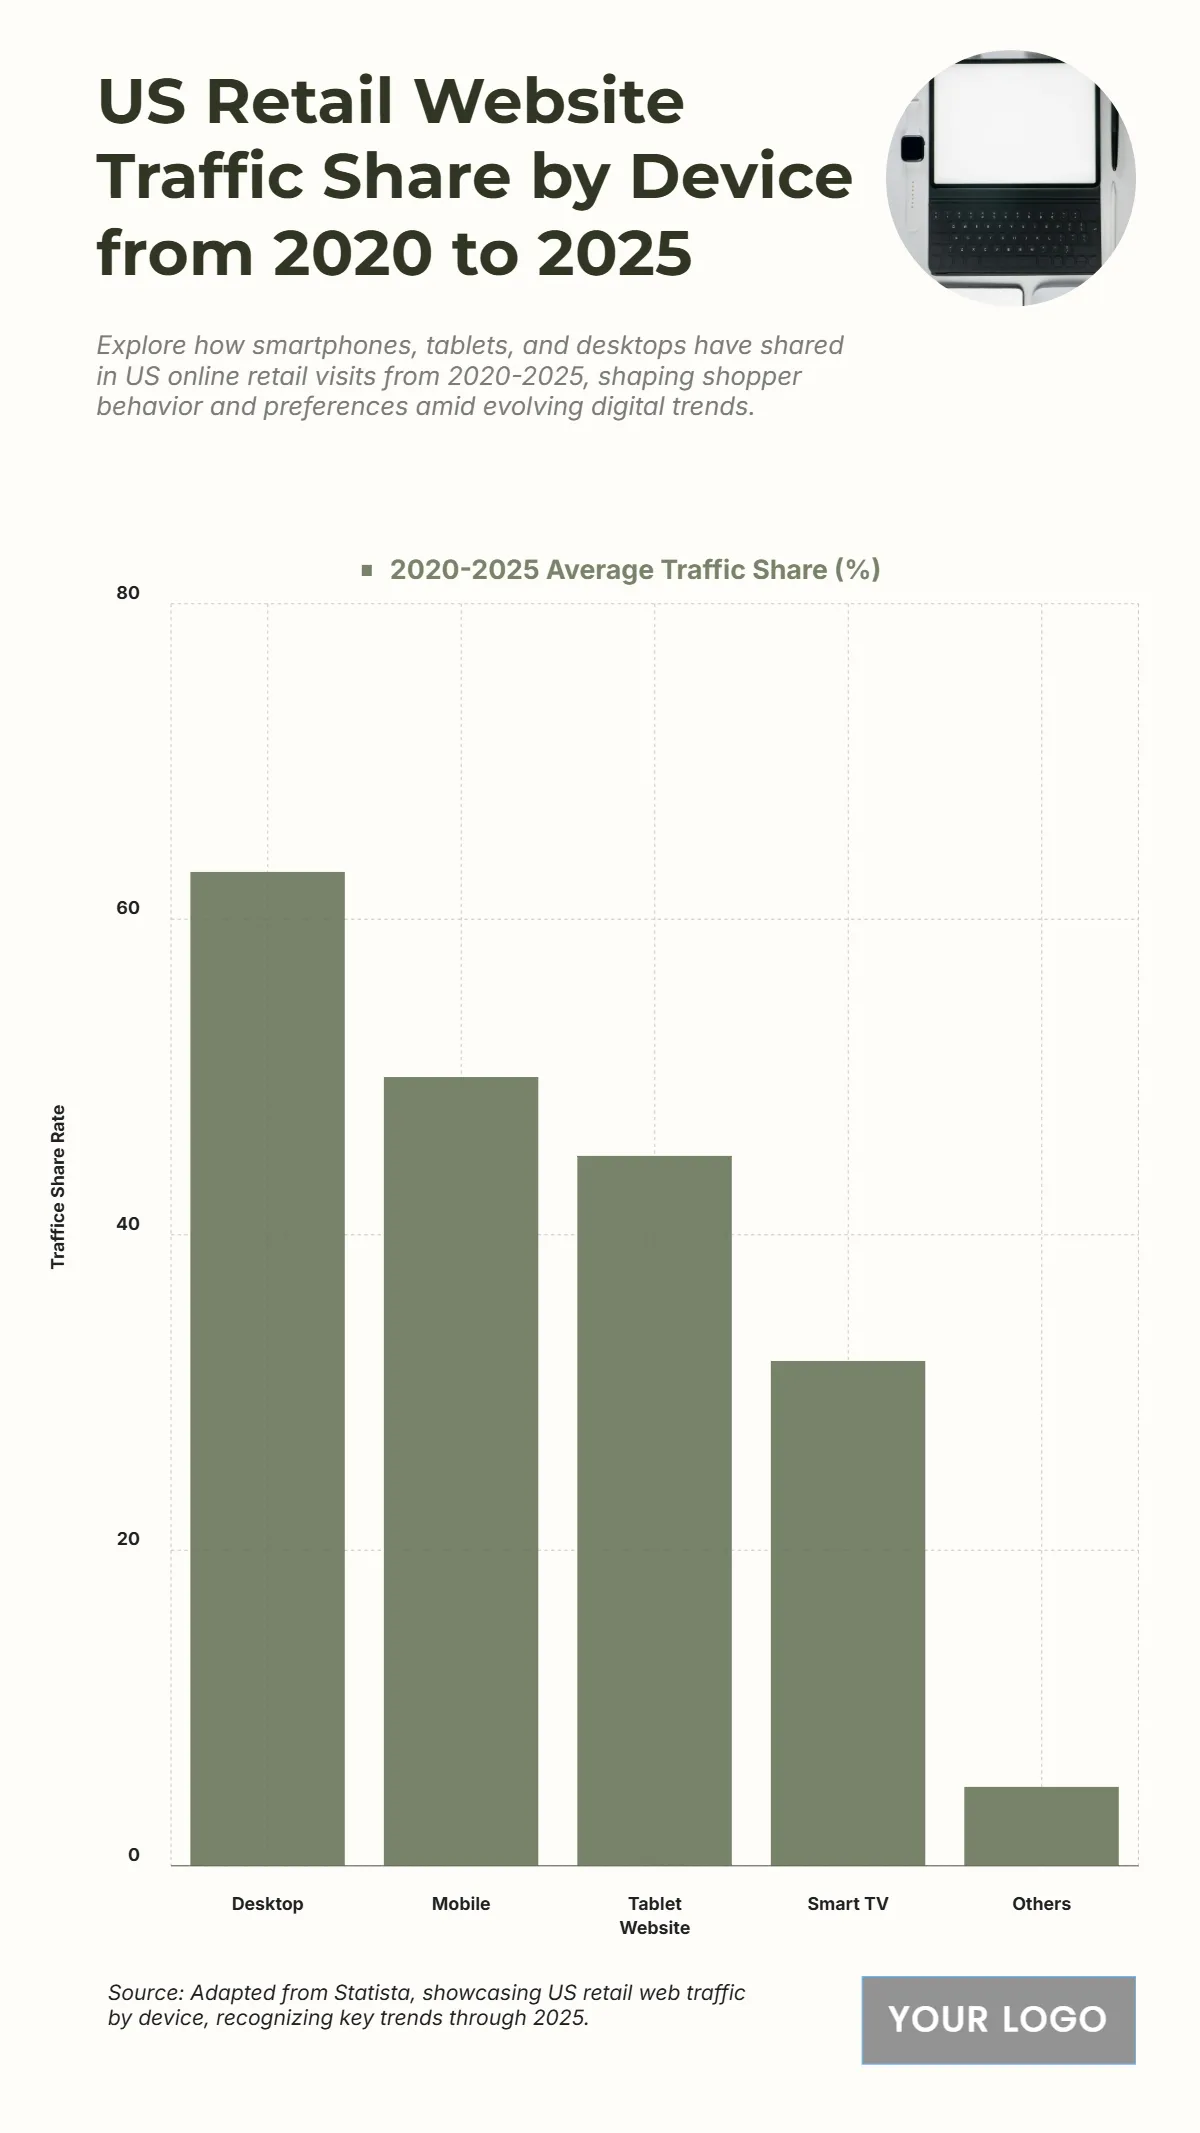
The chart presents the distribution of U.S. retail website traffic by device from 2020 to 2025, revealing clear dominance of traditional desktop browsing while highlighting the growth of mobile and tablet usage. Desktop devices account for the largest traffic share at 63%, underscoring their continued relevance for detailed product viewing and purchasing. Mobile devices follow closely with 50%, reflecting the rising trend of on-the-go shopping experiences and improved mobile interfaces. Tablets contribute 45%, maintaining their position as a preferred platform for browsing and online purchasing convenience. Meanwhile, Smart TVs capture 32% of total retail traffic, indicating growing adoption for connected shopping and media-driven retail exposure. Other devices collectively make up only 5%, showing limited influence on online retail visits. Overall, the data emphasizes that while desktops remain key for conversions, mobile and tablet devices continue to drive the shift toward multi-platform retail engagement.
| Labels | 2020–2025 Average Traffic Share (%) |
|---|---|
| Desktop | 63 |
| Mobile | 50 |
| Tablet | 45 |
| Smart TV | 32 |
| Others | 5 |


