Free US Cross-Platform Campaign Impressions by Industry from 2020 to 2025 Chart
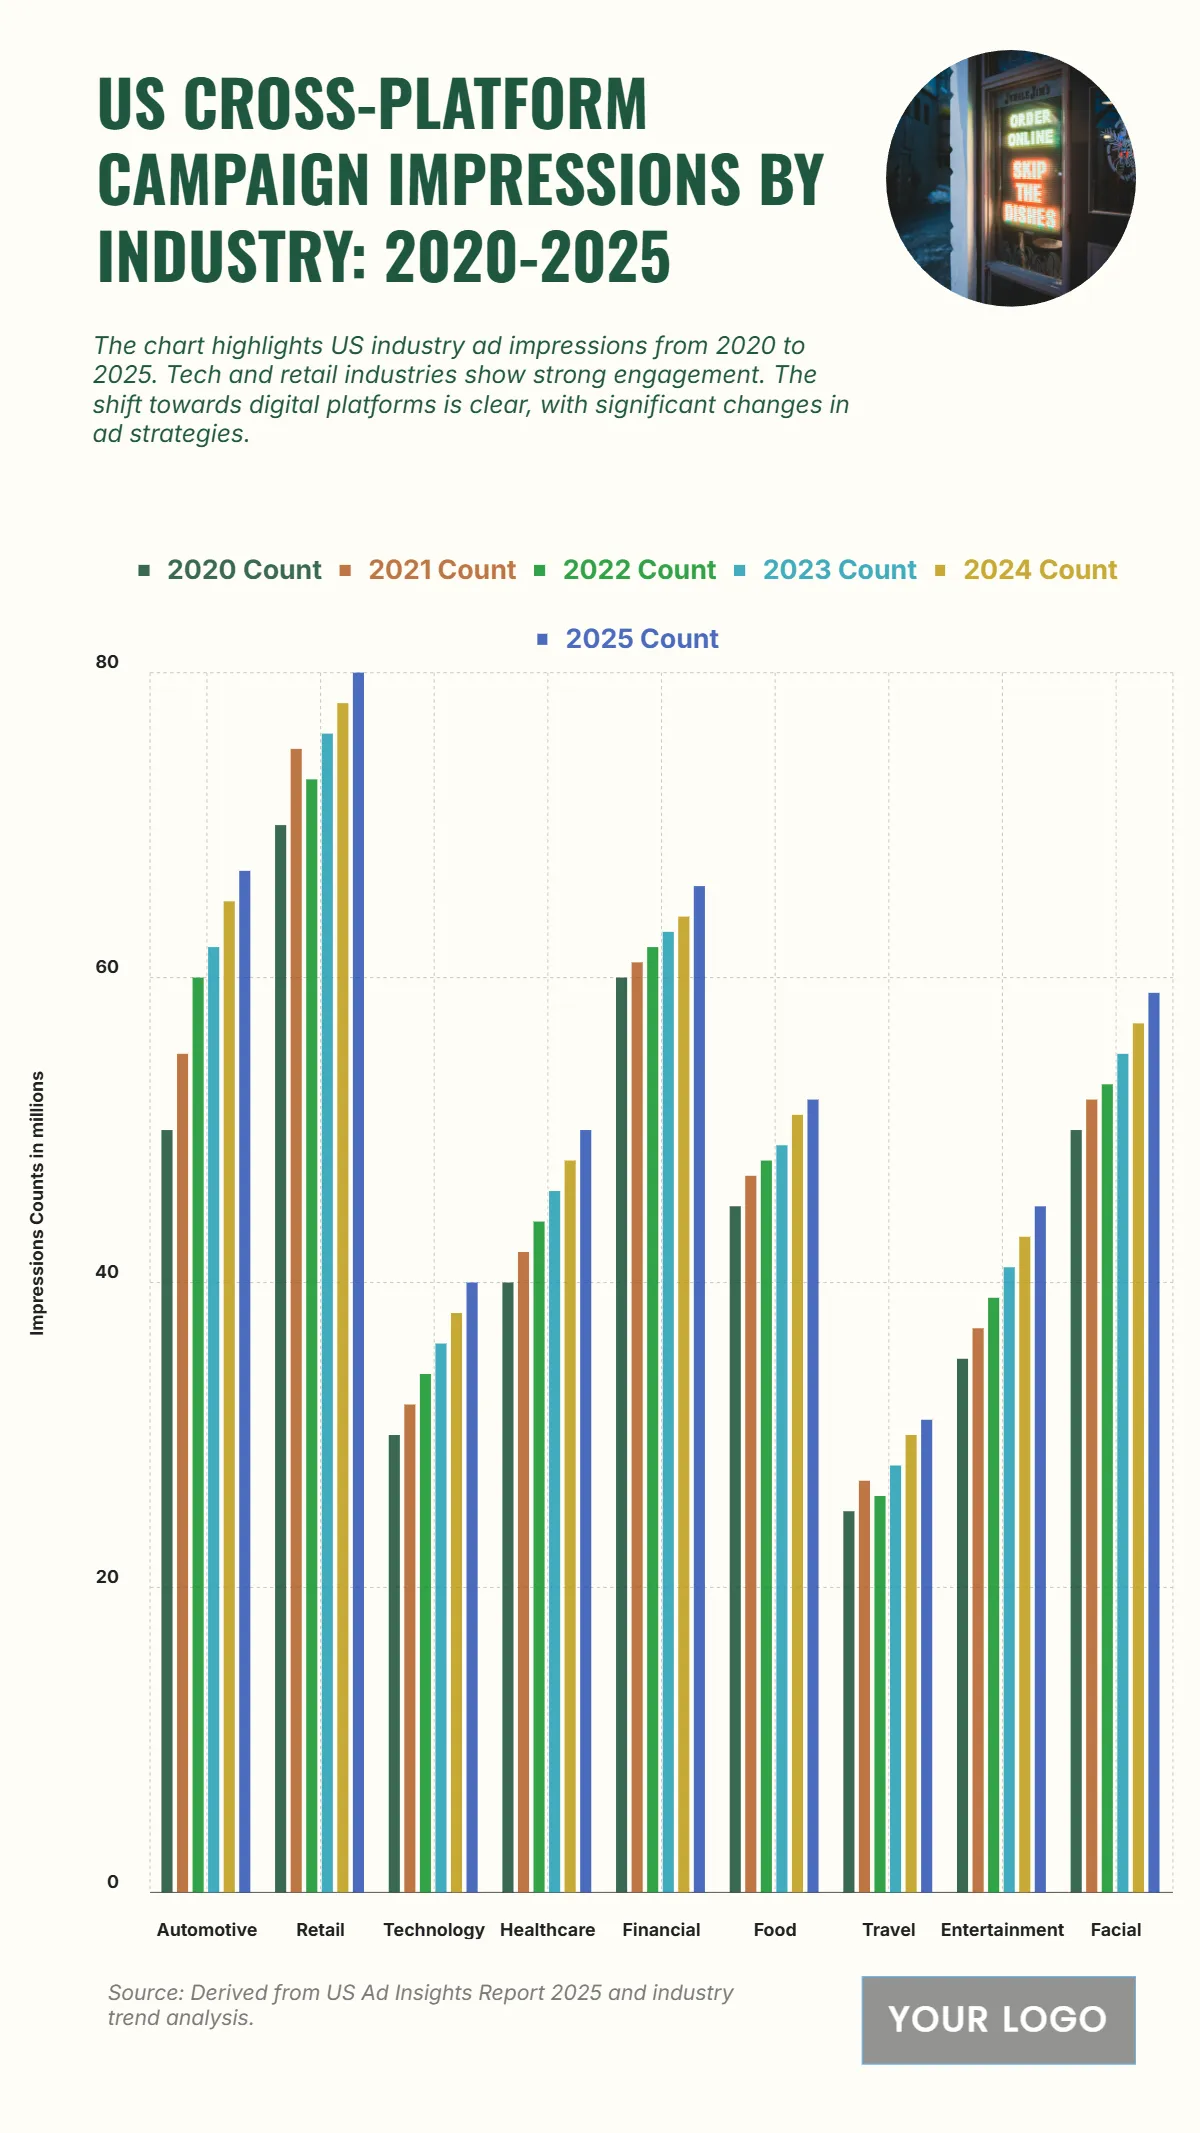
The chart shows a consistent rise in US cross-platform campaign impressions across major industries from 2020 to 2025, with Retail and Financial Services leading in total counts. Retail impressions grew from 70 in 2020 to 80 in 2025, maintaining the highest overall volume throughout the years. Financial Services followed closely, increasing from 60 to 66, reflecting stable and strong engagement. Automotive saw growth from 50 to 67, highlighting its expanding digital ad investment. Technology rose steadily from 30 to 40, and Healthcare climbed from 40 to 50, showing growing relevance in these sectors. Food & Beverage impressions increased from 45 to 52, while Travel improved from 25 to 31, indicating gradual recovery and expansion. Entertainment impressions rose from 35 to 45, and Telecommunications climbed from 50 to 59, signaling broad digital adoption across industries. This overall upward trajectory demonstrates a strategic and sustained shift towards digital platforms for ad campaigns across sectors.
| Labels | 2020 Count | 2021 Count | 2022 Count | 2023 Count | 2024 Count | 2025 Count |
|---|---|---|---|---|---|---|
| Automotive | 50 | 55 | 60 | 62 | 65 | 67 |
| Retail | 70 | 75 | 73 | 76 | 78 | 80 |
| Technology | 30 | 32 | 34 | 36 | 38 | 40 |
| Healthcare | 40 | 42 | 44 | 46 | 48 | 50 |
| Financial Services | 60 | 61 | 62 | 63 | 64 | 66 |
| Food & Beverage | 45 | 47 | 48 | 49 | 51 | 52 |
| Travel | 25 | 27 | 26 | 28 | 30 | 31 |
| Entertainment | 35 | 37 | 39 | 41 | 43 | 45 |
| Telecommunications | 50 | 52 | 53 | 55 | 57 | 59 |


