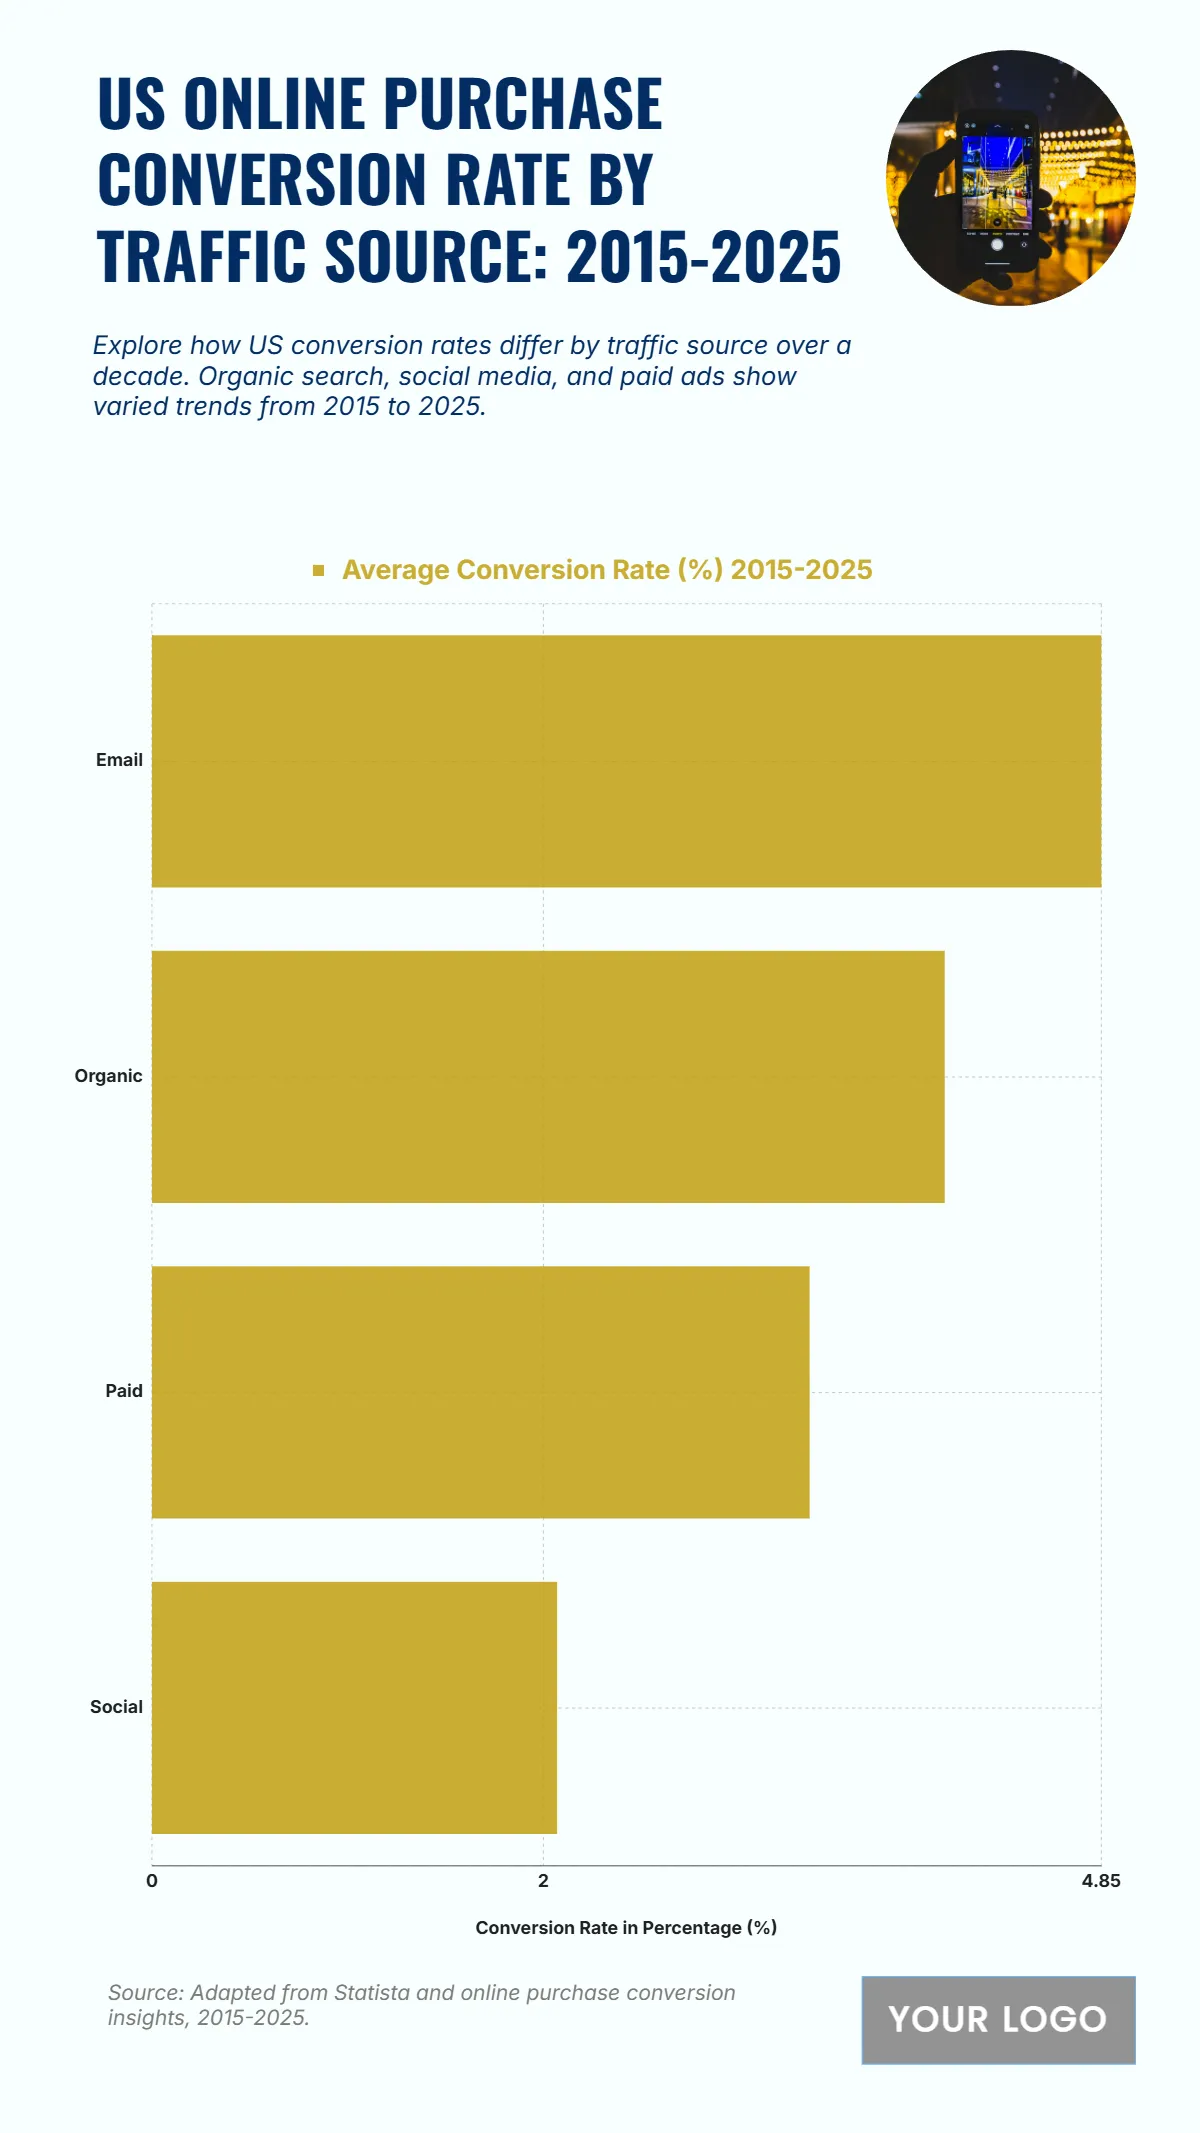
Free US Online Purchase Conversion Rate by Traffic Source from 2015 to 2025 Chart
The chart highlights how conversion rates vary significantly across different traffic sources in the U.S. from 2015 to 2025. Email traffic has the highest average conversion rate at 4.85%, demonstrating its strength as a direct and personalized marketing channel. Organic traffic follows with 4.05%, reflecting the effectiveness of search-driven and content-based strategies in driving purchase decisions. Paid traffic achieves a 3.36% conversion rate, indicating solid performance through targeted campaigns and retargeting. Meanwhile, social traffic records the lowest at 2.07%, showing that while social media drives awareness and engagement, it has lower direct conversion impact compared to other channels. This data underscores the importance of email and organic search in e-commerce conversions, while paid and social strategies play complementary roles in the broader marketing funnel.
| Labels | Average Conversion Rate (%) 2015–2025 |
|---|---|
| 4.85 | |
| Organic | 4.05 |
| Paid | 3.36 |
| Social | 2.07 |


