Free US Digital Ad Viewability Trends by Channel from 2020 to 2025 Chart
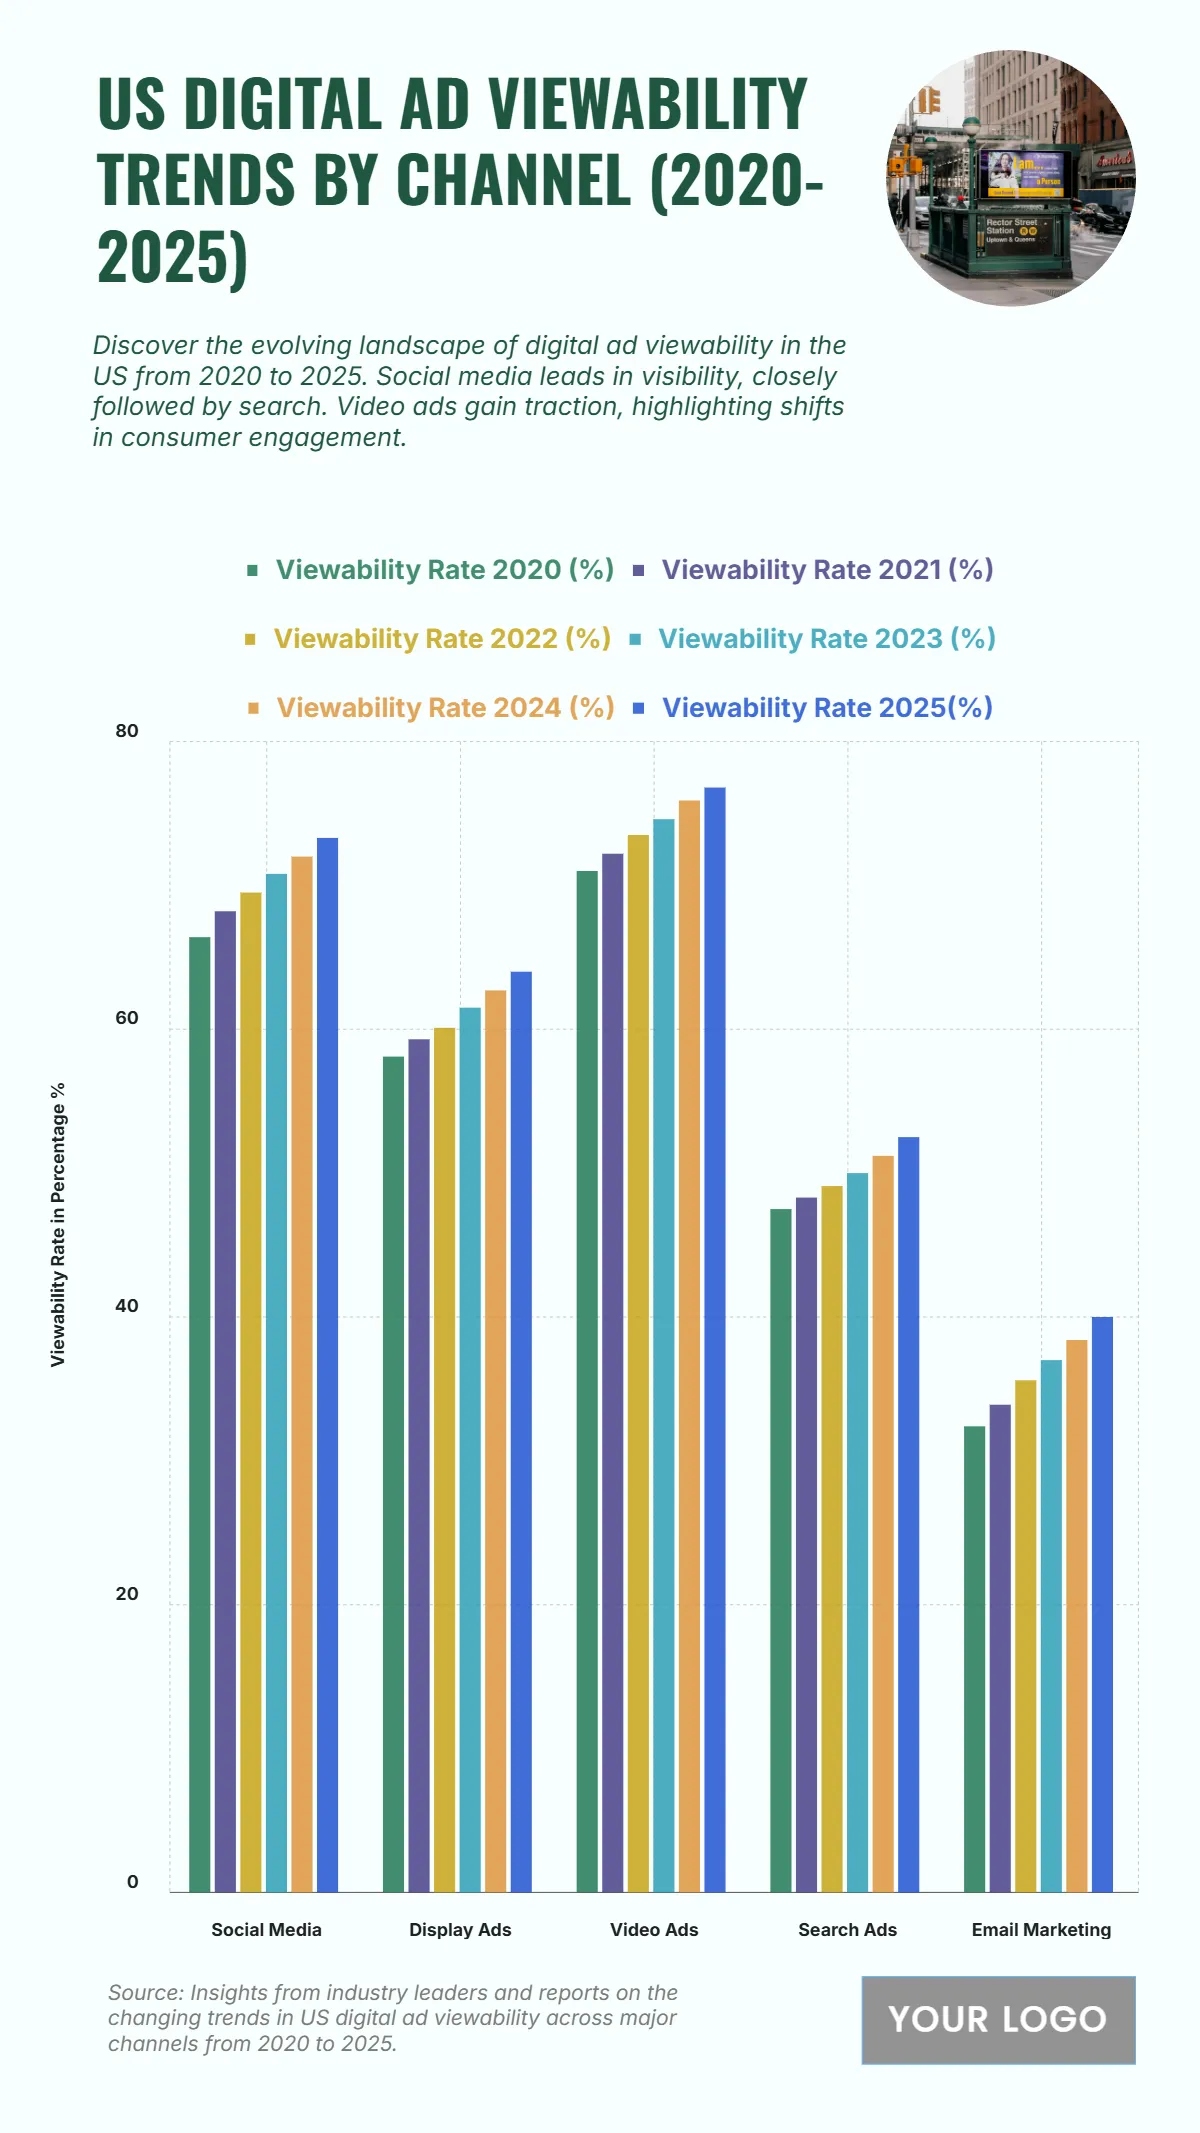
The chart reveals a steady rise in ad viewability across digital channels in the U.S. from 2020 to 2025. Video Ads lead consistently, starting at 71% in 2020 and climbing to 73.5% by 2022, reflecting the effectiveness of video formats in capturing user attention. Social Media follows closely, improving from 66.4% in 2020 to 69.5% in 2022, indicating increased engagement on platforms like Facebook, Instagram, and TikTok. Display Ads grow steadily from 58.1% to 60.1%, showing enhanced visual placement and targeting strategies. Search Ads improve modestly from 47.5% to 49.1%, remaining a reliable but less dominant channel for visibility. Email Marketing shows the lowest viewability, moving from 32.4% to 35.6%, which reflects its more niche, targeted nature. Overall, the upward trend indicates better ad placement, improved targeting, and increased user attention, with video and social channels leading this growth.
| Labels | Viewability Rate 2020 (%) | Viewability Rate 2021 (%) | Viewability Rate 2022 (%) |
|---|---|---|---|
| Social Media | 66.4 | 68.2 | 69.5 |
| Display Ads | 58.1 | 59.3 | 60.1 |
| Video Ads | 71.0 | 72.2 | 73.5 |
| Search Ads | 47.5 | 48.3 | 49.1 |
| Email Marketing | 32.4 | 33.9 | 35.6 |


