Free US Retailer Digital Marketing Budget Allocation from 2018 to 2025 Chart
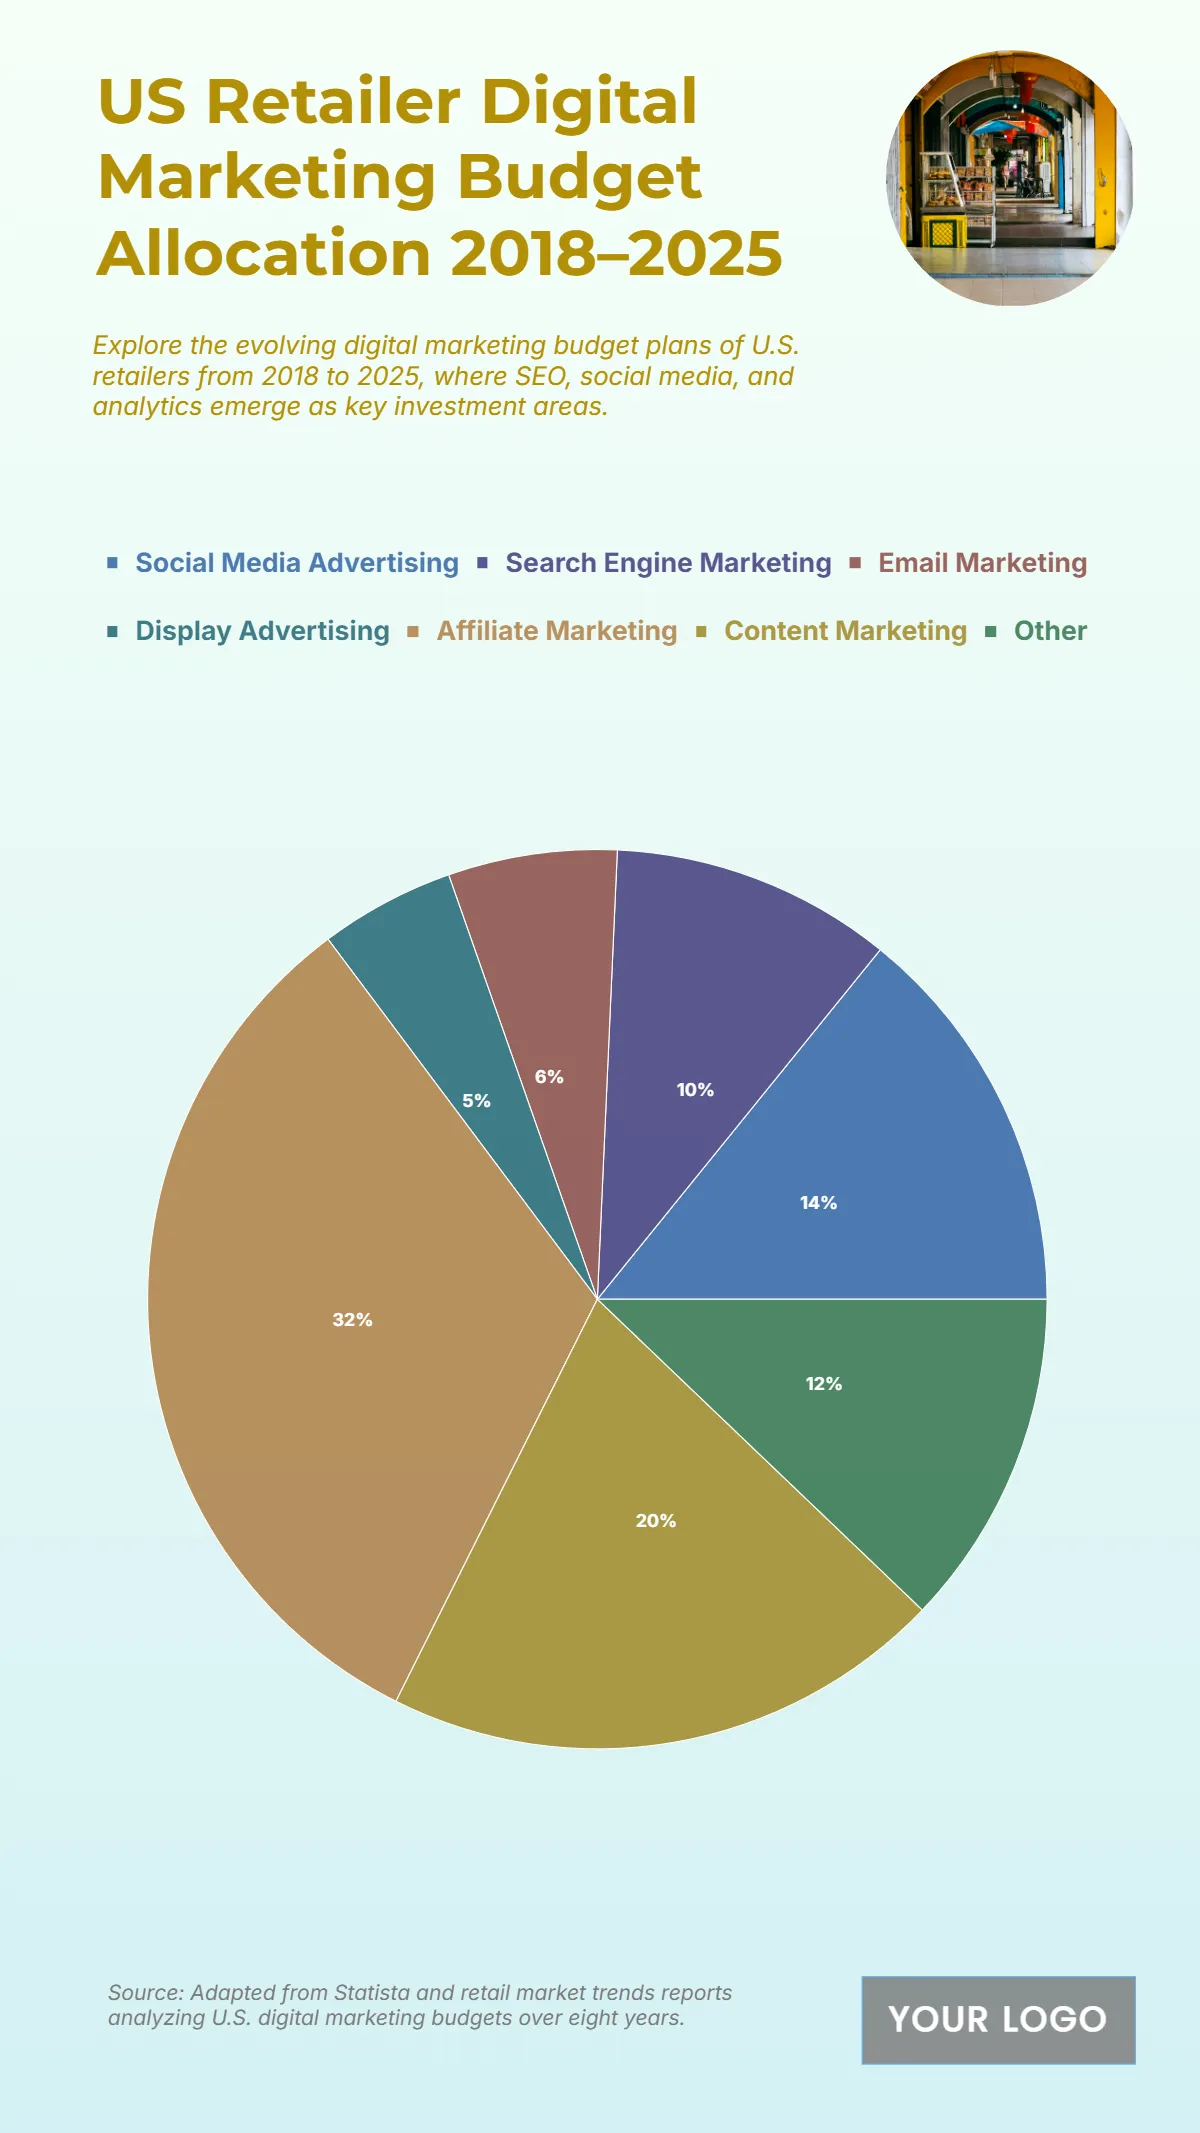
The chart illustrates how US retailers have allocated their digital marketing budgets from 2018 to 2025, emphasizing the dominance of social and content-driven strategies. Affiliate Marketing surprisingly takes the largest share at 80 units, showing the strong performance of partnership-based advertising in driving conversions. Content Marketing follows at 50 units, underlining its growing importance in engagement and brand storytelling. Social Media Advertising holds a significant 35, reflecting its central role in reaching consumers. Search Engine Marketing and Email Marketing receive 25 and 15, respectively, showing steady reliance on targeted and organic approaches. Display Advertising contributes 12, while Other channels hold 30, highlighting diversified spending. This distribution reveals a strategic shift towards affiliate and content initiatives, with social media and search maintaining strong support in overall marketing mixes.
| Labels | 2018-2025 Budget Allocation |
|---|---|
| Social Media Advertising | 35 |
| Search Engine Marketing | 25 |
| Email Marketing | 15 |
| Display Advertising | 12 |
| Affiliate Marketing | 80 |
| Content Marketing | 50 |
| Other | 30 |


