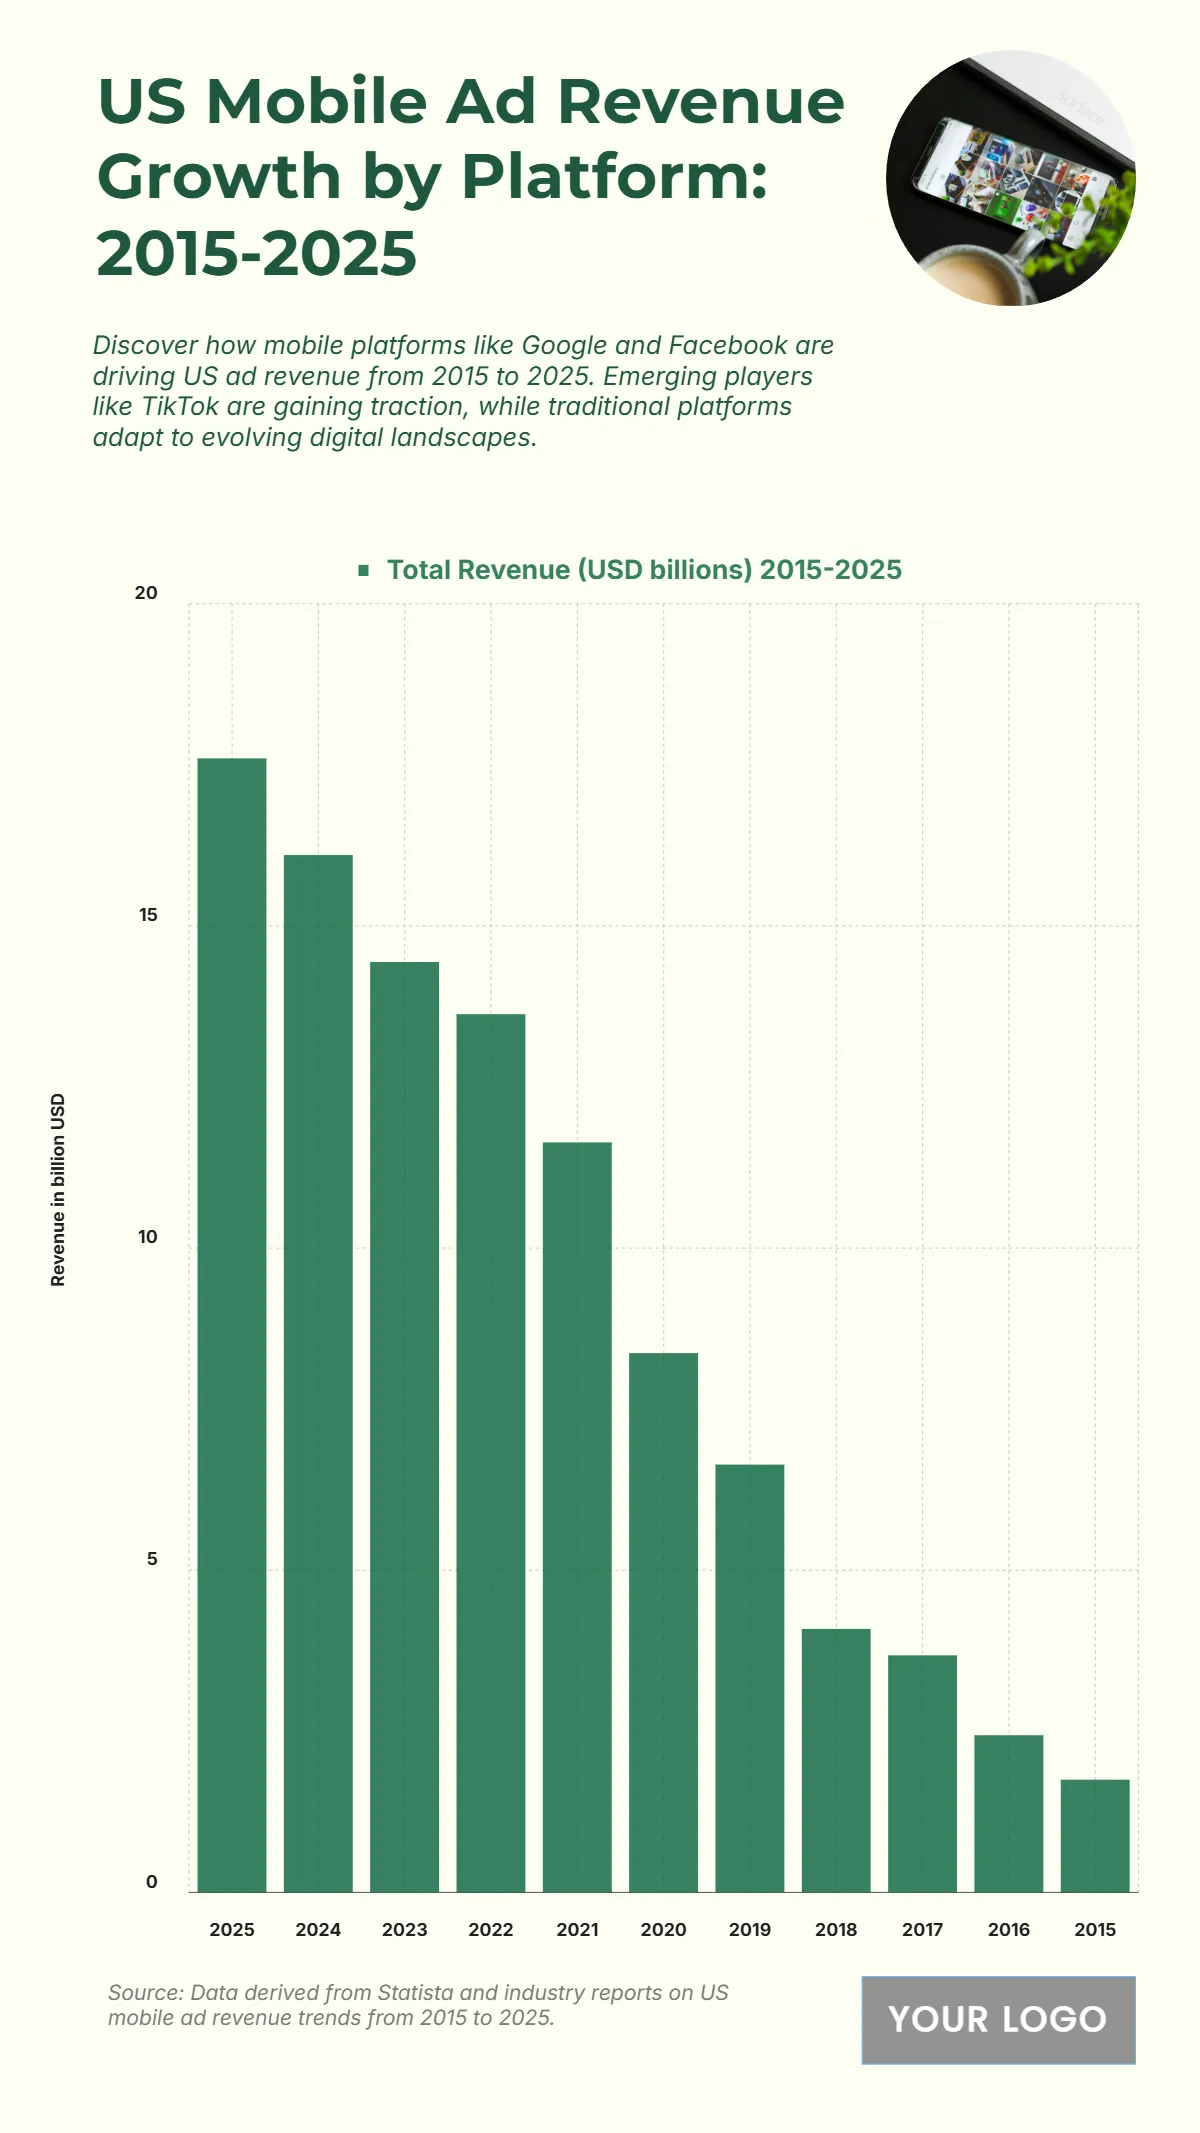
Free US Mobile Ad Revenue Growth by Platform from 2015 to 2025 Chart
The chart displays a remarkable rise in mobile ad revenue over the decade, highlighting the explosive growth of mobile advertising. Revenue climbed from USD 1.75 billion in 2015 to USD 17.6 billion in 2025, showcasing how mobile has become the centerpiece of digital marketing strategies. Notably, there’s a rapid acceleration post-2019, rising from USD 6.64 billion in 2019 to USD 11.64 billion in 2021 and USD 16.1 billion in 2024. This surge is attributed to increased smartphone penetration, dominance of mobile-first platforms, and advertisers shifting budgets from traditional channels. The data underscores how mobile advertising is no longer supplementary but central, driving the largest share of digital revenue across platforms.
| Labels | Total Revenue (USD billions) 2015–2025 |
|---|---|
| 2025 | 17.6 |
| 2024 | 16.1 |
| 2023 | 14.44 |
| 2022 | 13.63 |
| 2021 | 11.64 |
| 2020 | 8.37 |
| 2019 | 6.64 |
| 2018 | 4.09 |
| 2017 | 3.68 |
| 2016 | 2.44 |
| 2015 | 1.75 |


