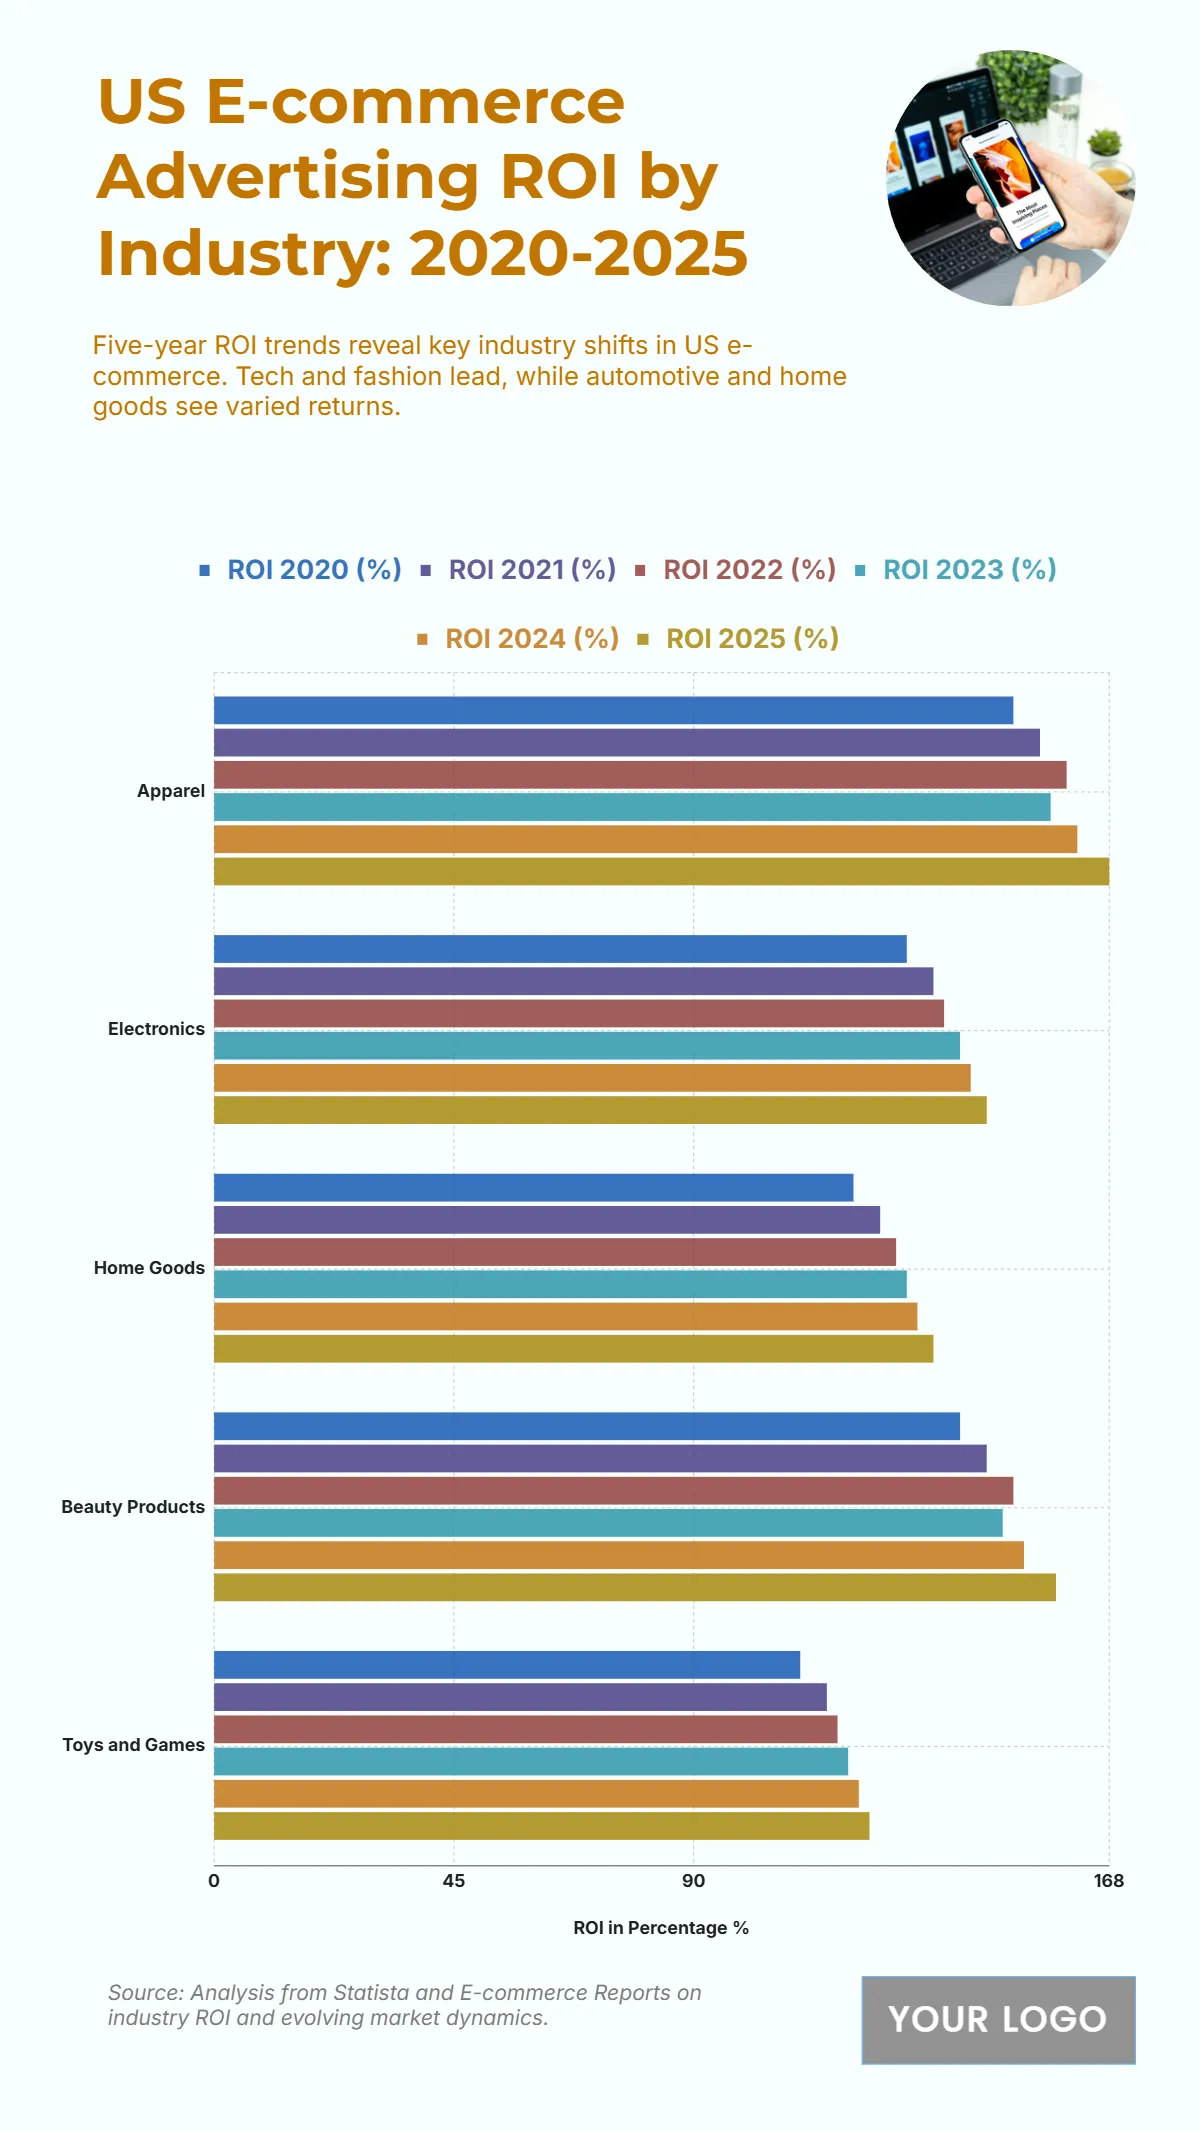
Free US E-commerce Advertising ROI by Industry from 2020 to 2025 Chart
The chart emphasizes the strong and growing ROI in U.S. e-commerce advertising, with Apparel consistently leading, rising from 150% in 2020 to 168% in 2025, reflecting the dominance of fashion and apparel in online retail. Beauty Products also show impressive growth, increasing from 140% to 158%, driven by influencer campaigns and visual marketing strategies. Electronics rise from 130% to 145%, highlighting the strong performance of digital product promotions. Home Goods steadily climb from 120% to 135%, while Toys and Games show modest growth from 110% to 123%. These figures indicate that fashion, beauty, and tech remain the most lucrative categories, while other industries steadily build digital advertising efficiency and returns.
| Labels | ROI 2020 (%) | ROI 2021 (%) | ROI 2022 (%) | ROI 2023 (%) | ROI 2024 (%) | ROI 2025 (%) |
|---|---|---|---|---|---|---|
| Apparel | 150 | 155 | 160 | 157 | 162 | 168 |
| Electronics | 130 | 135 | 137 | 140 | 142 | 145 |
| Home Goods | 120 | 125 | 128 | 130 | 132 | 135 |
| Beauty Products | 140 | 145 | 150 | 148 | 152 | 158 |
| Toys and Games | 110 | 115 | 117 | 119 | 121 | 123 |


