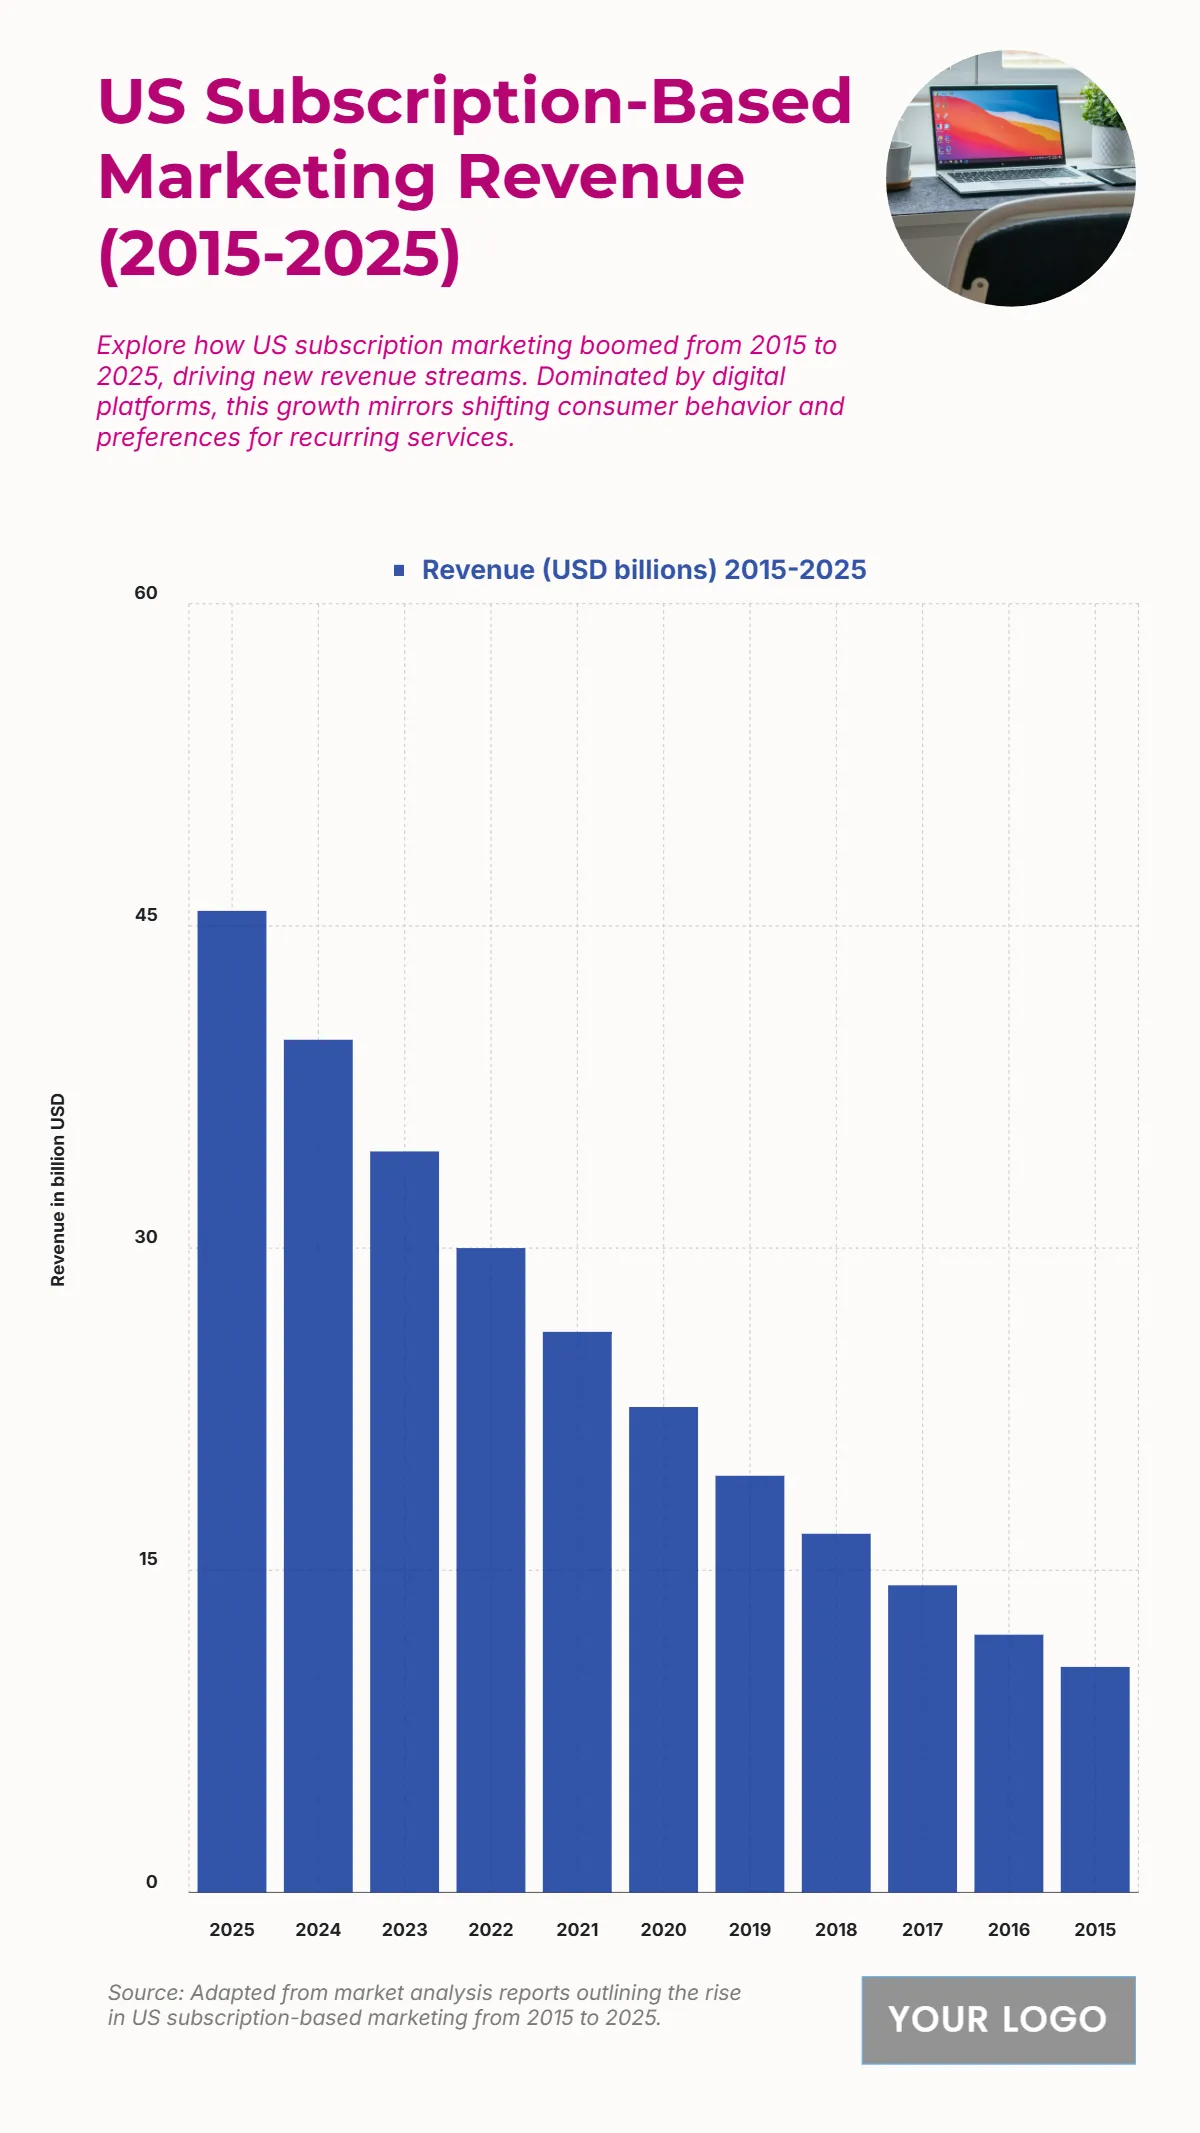
Free US Subscription-Based Marketing Revenue from 2015 to 2025 Chart
The chart shows a consistent increase in subscription-based marketing revenue in the U.S. from USD 10.5 billion in 2015 to USD 45.7 billion in 2025, underscoring the growing consumer preference for recurring service models. A significant surge occurs after 2020, with revenue reaching USD 22.6 billion, reflecting the pandemic-driven shift to digital consumption. This upward momentum continues with USD 30 billion in 2022, USD 39.7 billion in 2024, and peaking at USD 45.7 billion in 2025. The decade-long expansion mirrors the evolution of digital platforms, personalization strategies, and automated billing systems, making subscriptions a dominant revenue channel for many industries. Overall, this data highlights strong long-term growth and the strategic importance of subscription models in digital marketing.
| Labels | Revenue (USD billions) 2015–2025 |
|---|---|
| 2025 | 45.7 |
| 2024 | 39.7 |
| 2023 | 34.5 |
| 2022 | 30 |
| 2021 | 26.1 |
| 2020 | 22.6 |
| 2019 | 19.4 |
| 2018 | 16.7 |
| 2017 | 14.3 |
| 2016 | 12 |
| 2015 | 10.5 |


