Free US Consumer Behavior Shift Toward Online Shopping from 2015 to 2025 Chart
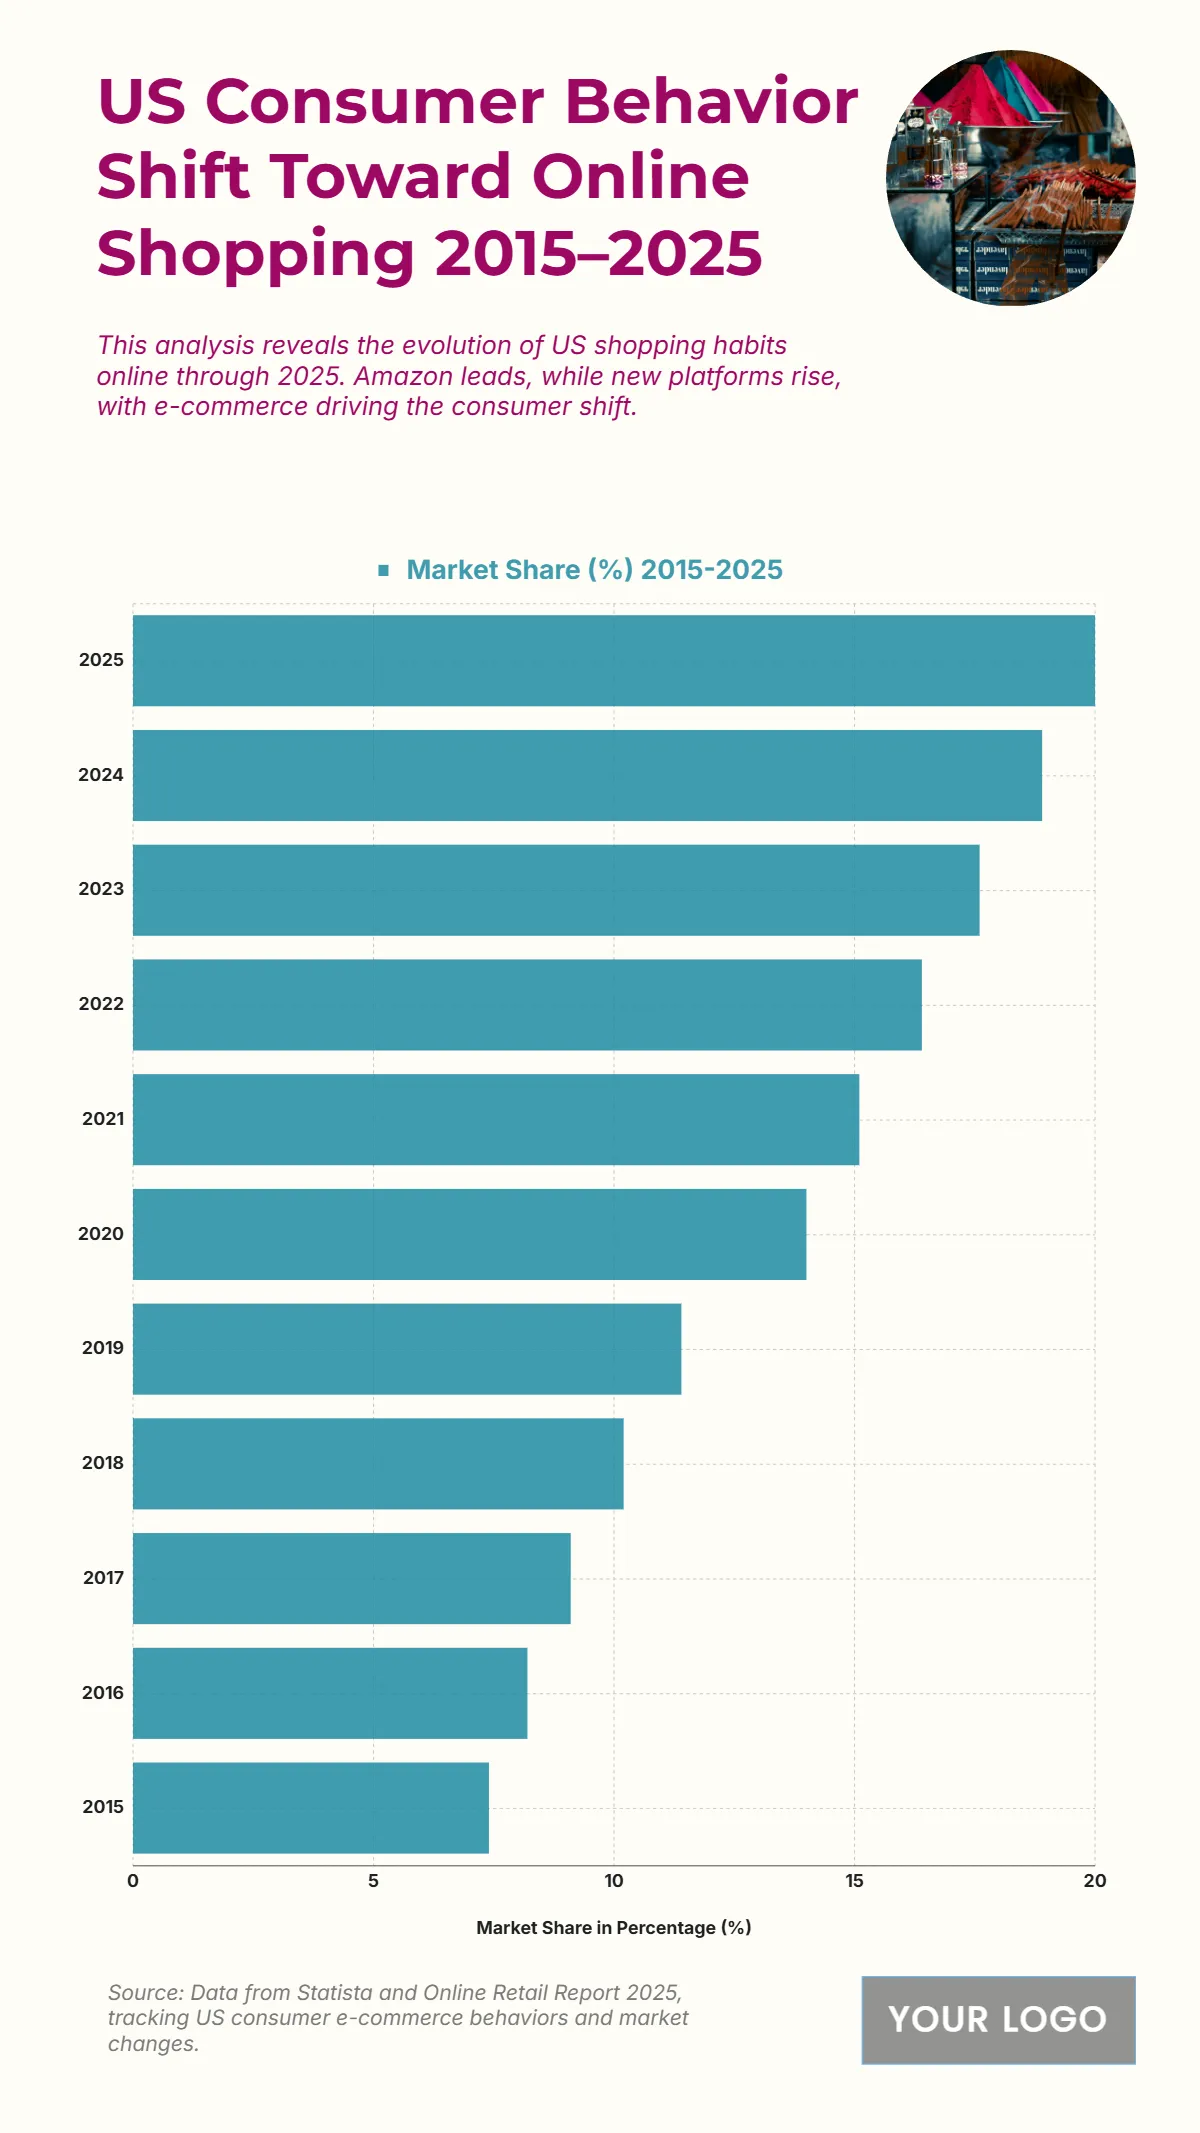
The chart highlights the dramatic rise in online shopping market share from 7.4% in 2015 to 20% in 2025, illustrating a major shift in U.S. consumer behavior. The most rapid growth occurs after 2019, with market share rising from 11.4% in 2019 to 14% in 2020, reflecting increased digital adoption during and after the pandemic. Steady gains continue through 16.4% in 2022, 18.9% in 2024, and peak at 20% in 2025. This upward trend is fueled by e-commerce platform expansion, faster logistics, personalized shopping experiences, and mobile-first strategies, making online shopping a dominant retail channel. The data reflects a structural change in retail habits, favoring digital convenience over traditional store-based purchasing.
| Labels | Market Share (%) 2015–2025 |
|---|---|
| 2025 | 20 |
| 2024 | 18.9 |
| 2023 | 17.6 |
| 2022 | 16.4 |
| 2021 | 15.1 |
| 2020 | 14 |
| 2019 | 11.4 |
| 2018 | 10.2 |
| 2017 | 9.1 |
| 2016 | 8.2 |
| 2015 | 7.4 |


