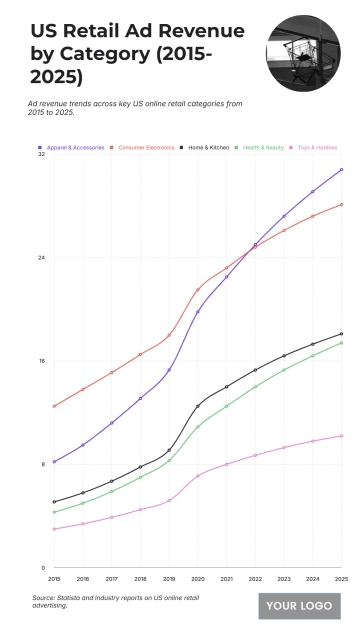
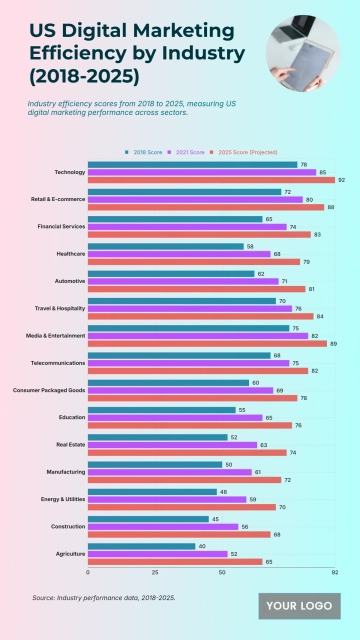
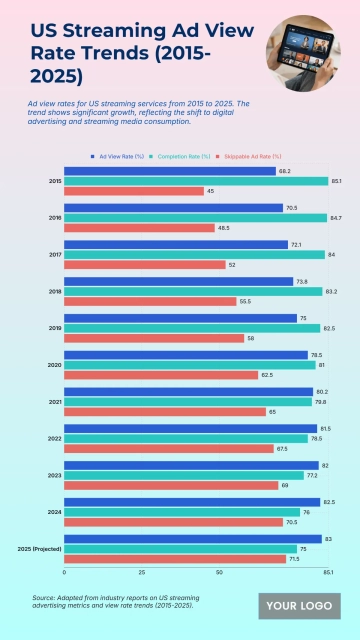
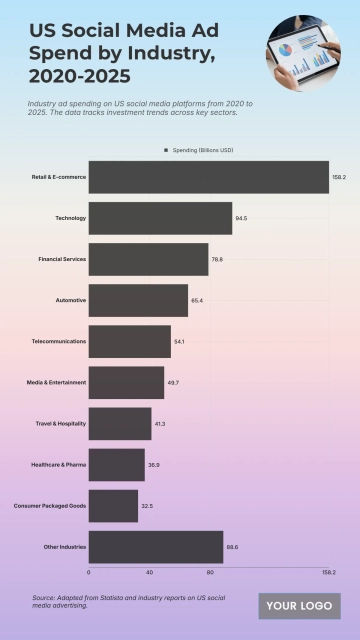
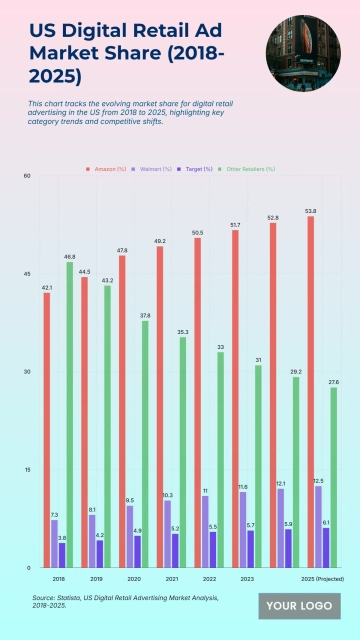
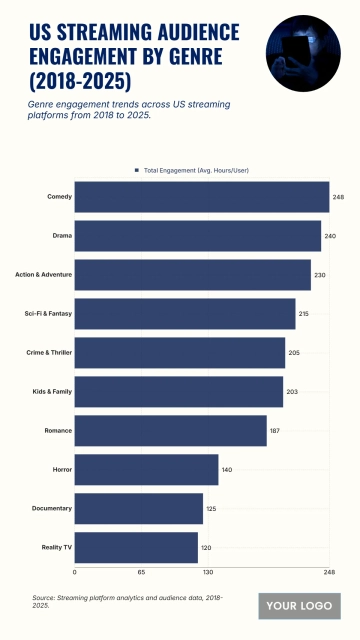
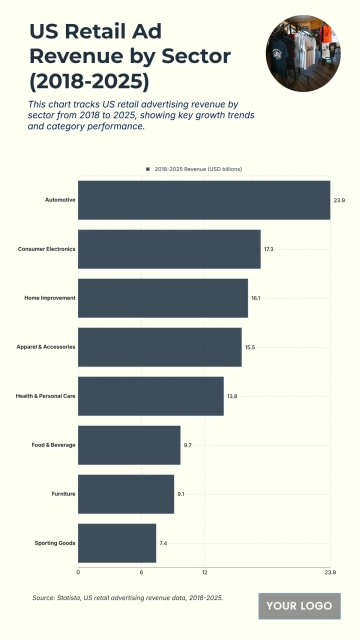
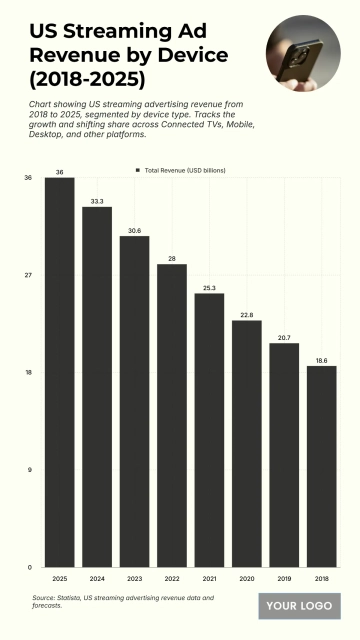
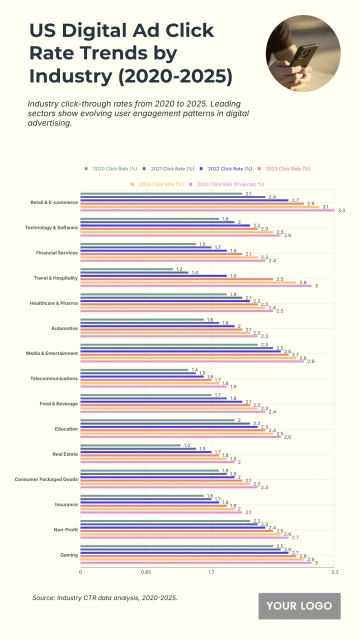
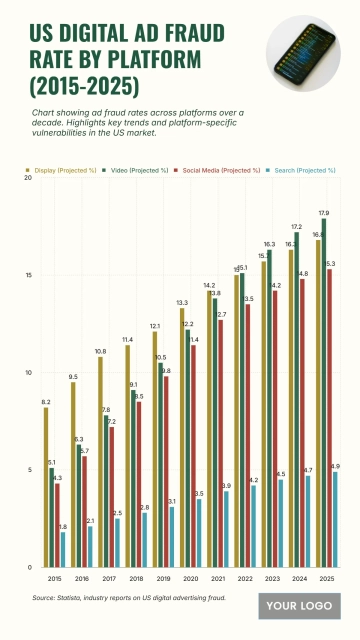
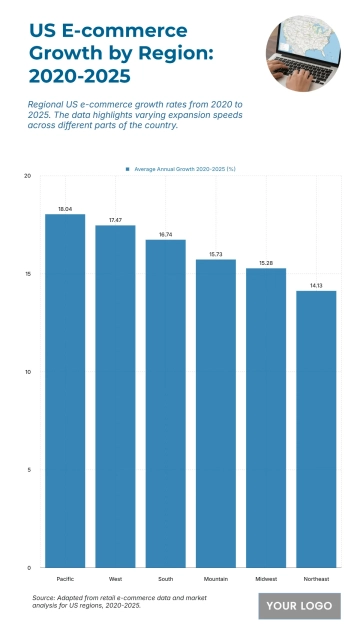
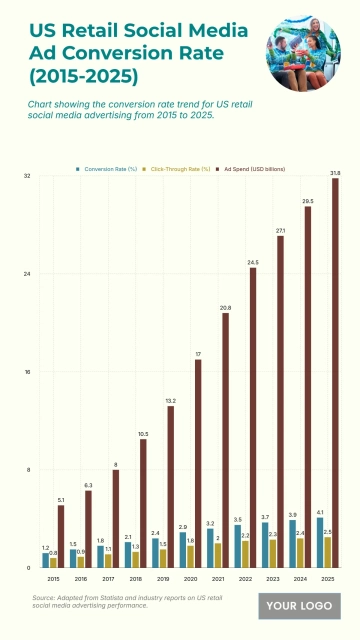
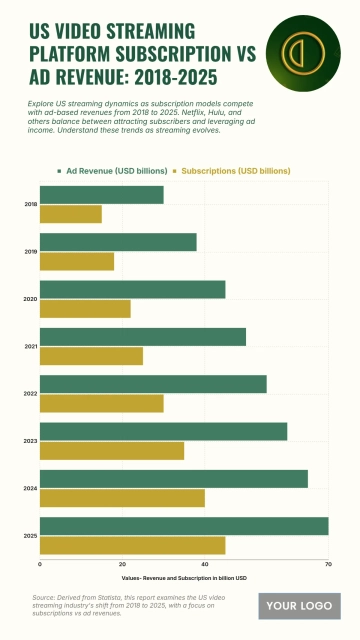
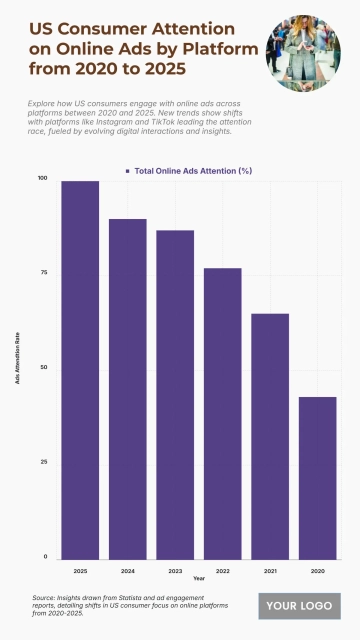
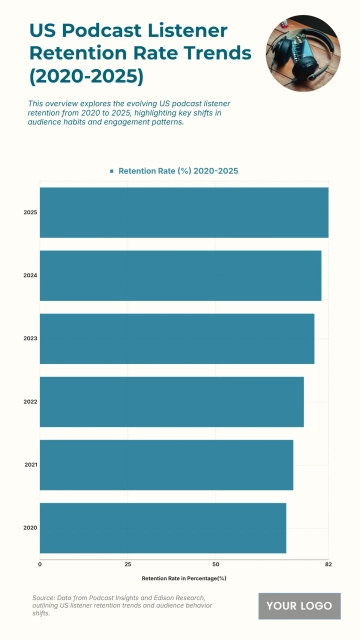
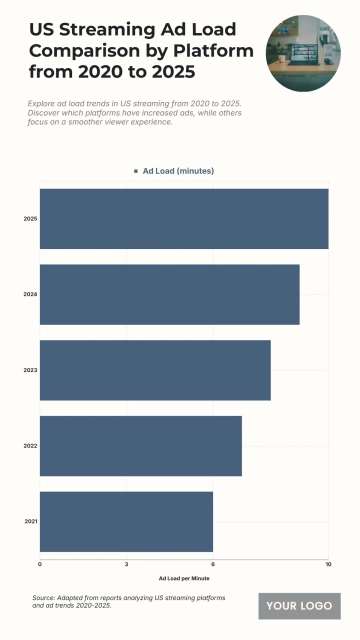
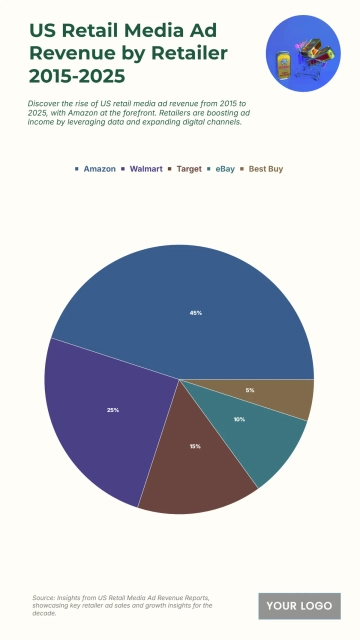
US Video Streaming Platform Ad Revenue by Category from 2020 to 2025 Chart Template with a horizontal bar chart

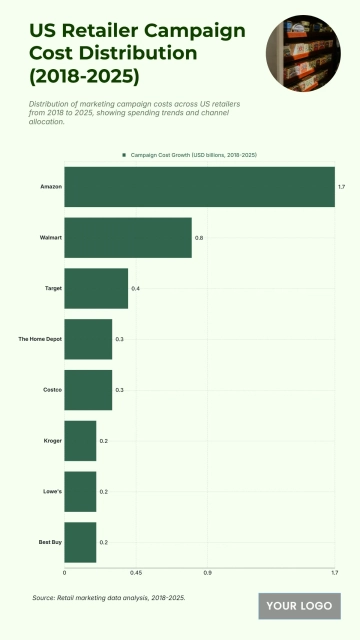
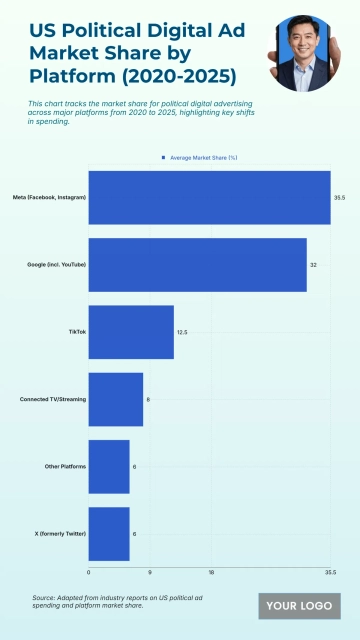
A professional 9:16 advertising chart for comparing US video streaming platform ad revenue from 2020 to 2025, professionally designed by Template.net, with a horizontal bar chart, a streaming app icon and a logo placeholder in teal, raspberry crimson and pale mint.
Customize it in two ways:

  • Editable with AI Replace the logo in [logo_image_1] with [Upload image], replace the logo in [logo_image_2] with [Upload image], and replace the text with [text_input], change to relevant elements while keeping similar style, composition and background.
  • Easily edit it manually: customize the content, elements, photos, colors and fonts.

Free US Video Streaming Platform Ad Revenue by Category from 2020 to 2025 Chart Template

By Template.net

Open Editor
Infographics Generator