Free US Digital Advertising Revenue Share by State from 2015 to 2025 Chart
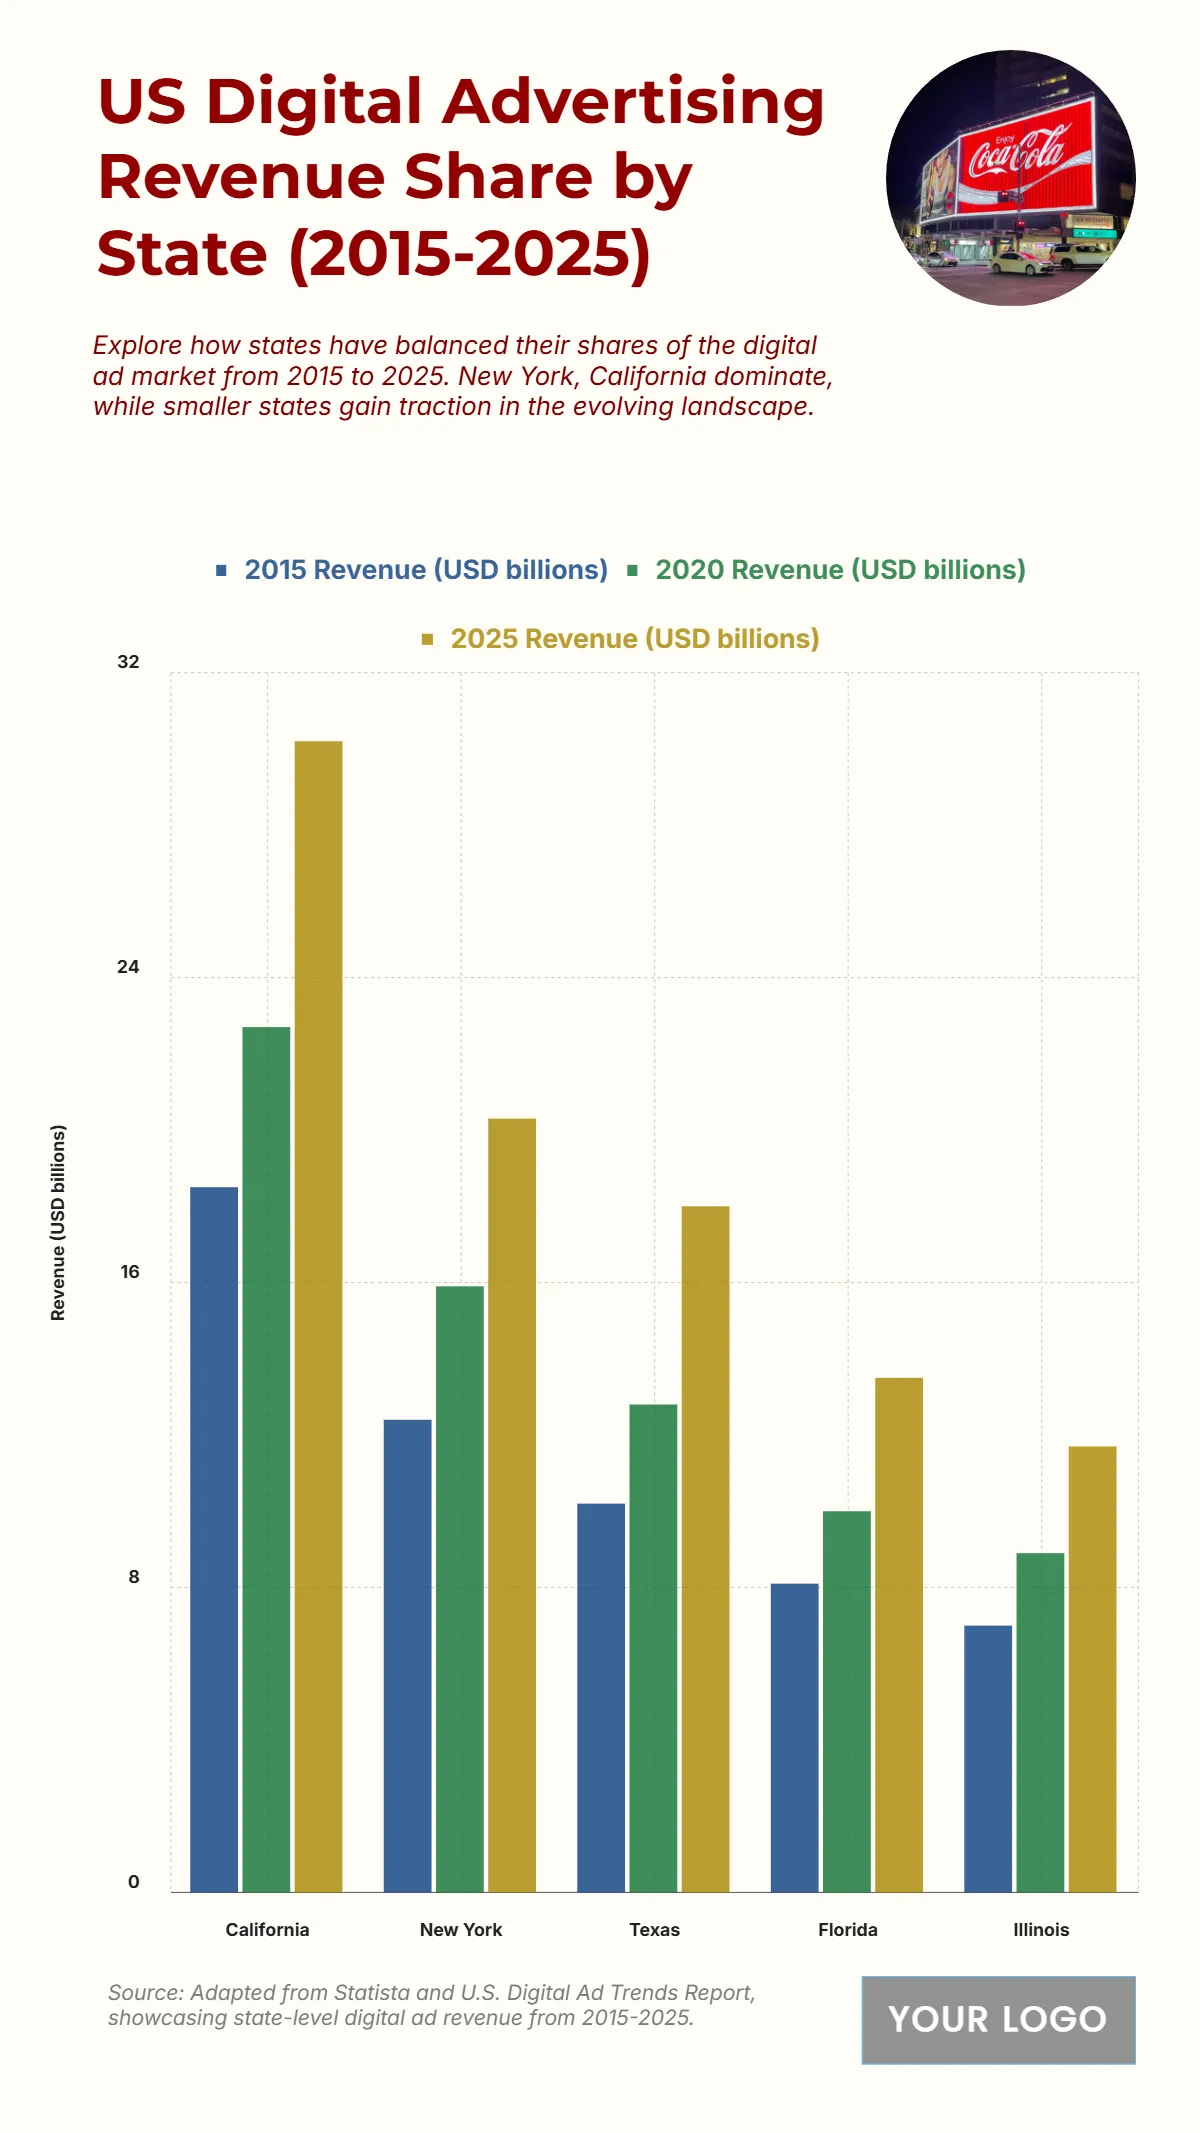
The chart outlines a strong growth in digital advertising revenue across leading U.S. states, with California reaching USD 30.2 billion in 2025, up from USD 18.5 billion in 2015, confirming its dominant market position. New York follows at USD 20.3 billion, reflecting its role as a major business and media hub. Texas grows to USD 18 billion, while Florida reaches USD 13.5 billion and Illinois USD 11.7 billion. All states exhibit a steady increase over the decade, driven by regional digital adoption, targeted ad strategies, and expanding local business ecosystems. California’s lead demonstrates the concentration of digital marketing power in high-tech and media-rich states.
| Labels | 2015 Revenue (USD billions) | 2020 Revenue (USD billions) | 2025 Revenue (USD billions) |
|---|---|---|---|
| California | 18.5 | 22.7 | 30.2 |
| New York | 12.4 | 15.9 | 20.3 |
| Texas | 10.2 | 12.8 | 18 |
| Florida | 8.1 | 10 | 13.5 |
| Illinois | 7.0 | 8.9 | 11.7 |


