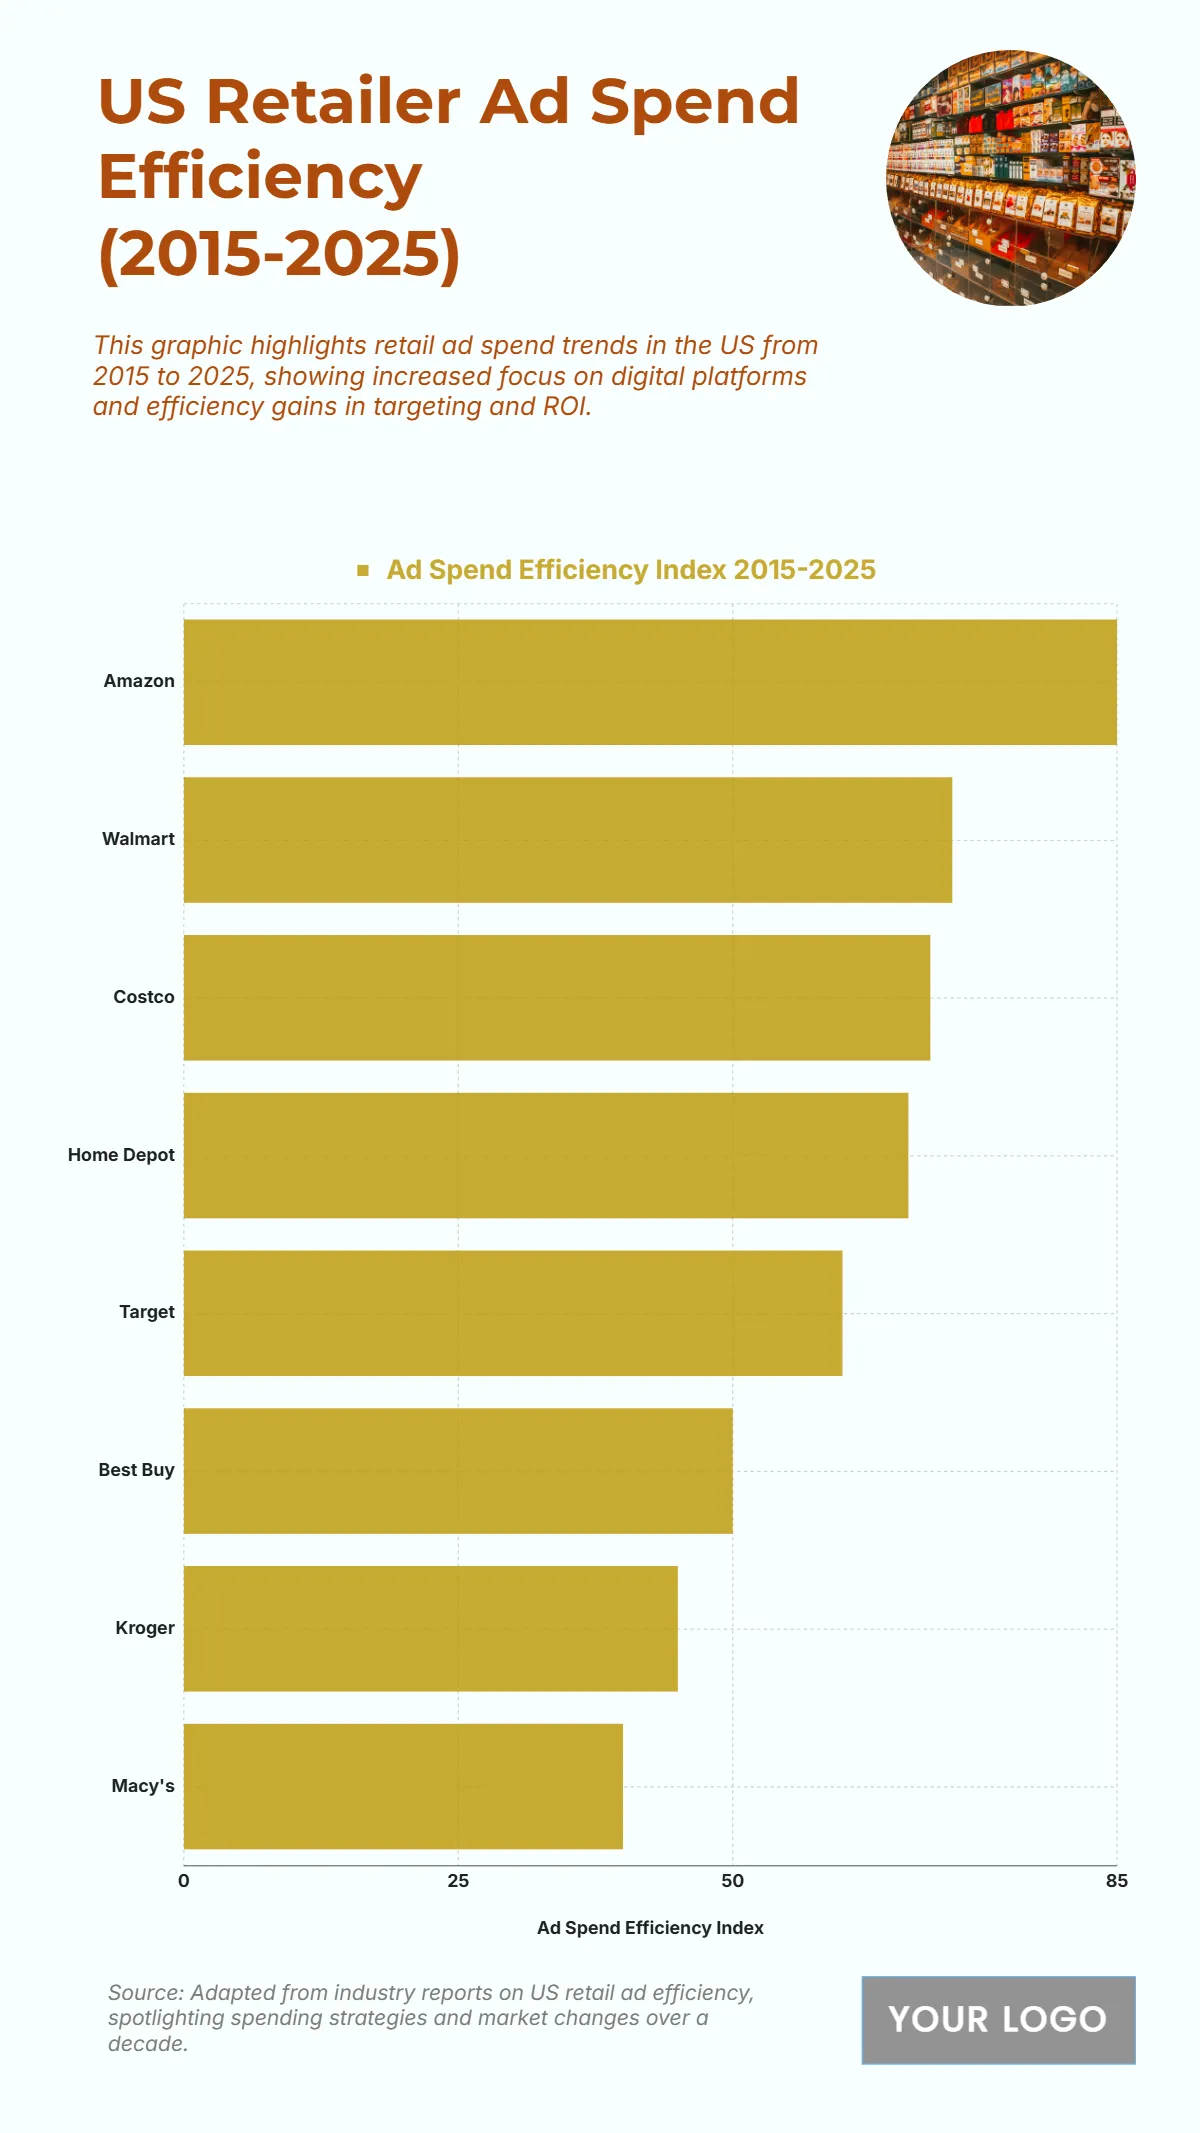
Free US Retailer Ad Spend Efficiency from 2015 to 2025 Chart
The chart highlights a clear efficiency hierarchy among major U.S. retailers, with Amazon leading at an index of 85, showing its strong ROI and advanced digital ad strategies. Walmart follows with 70, leveraging its large-scale retail presence. Costco (68) and Home Depot (66) display strong efficiency, underscoring their effective media allocation. Mid-tier performers include Target at 60 and Best Buy at 50, showing steady digital adaptation. Kroger (45) and Macy’s (40) rank lower, reflecting either traditional ad dependencies or less optimized digital campaigns. This distribution reveals the growing gap between top digital advertisers and traditional retailers, with Amazon maintaining a dominant lead through advanced programmatic and targeted advertising.
| Labels | Ad Spend Efficiency Index 2015–2025 |
|---|---|
| Amazon | 85 |
| Walmart | 70 |
| Costco | 68 |
| Home Depot | 66 |
| Target | 60 |
| Best Buy | 50 |
| Kroger | 45 |
| Macy’s | 40 |


