Free US Ad Spending by Small vs Large Businesses from 2015 to 2025 Chart
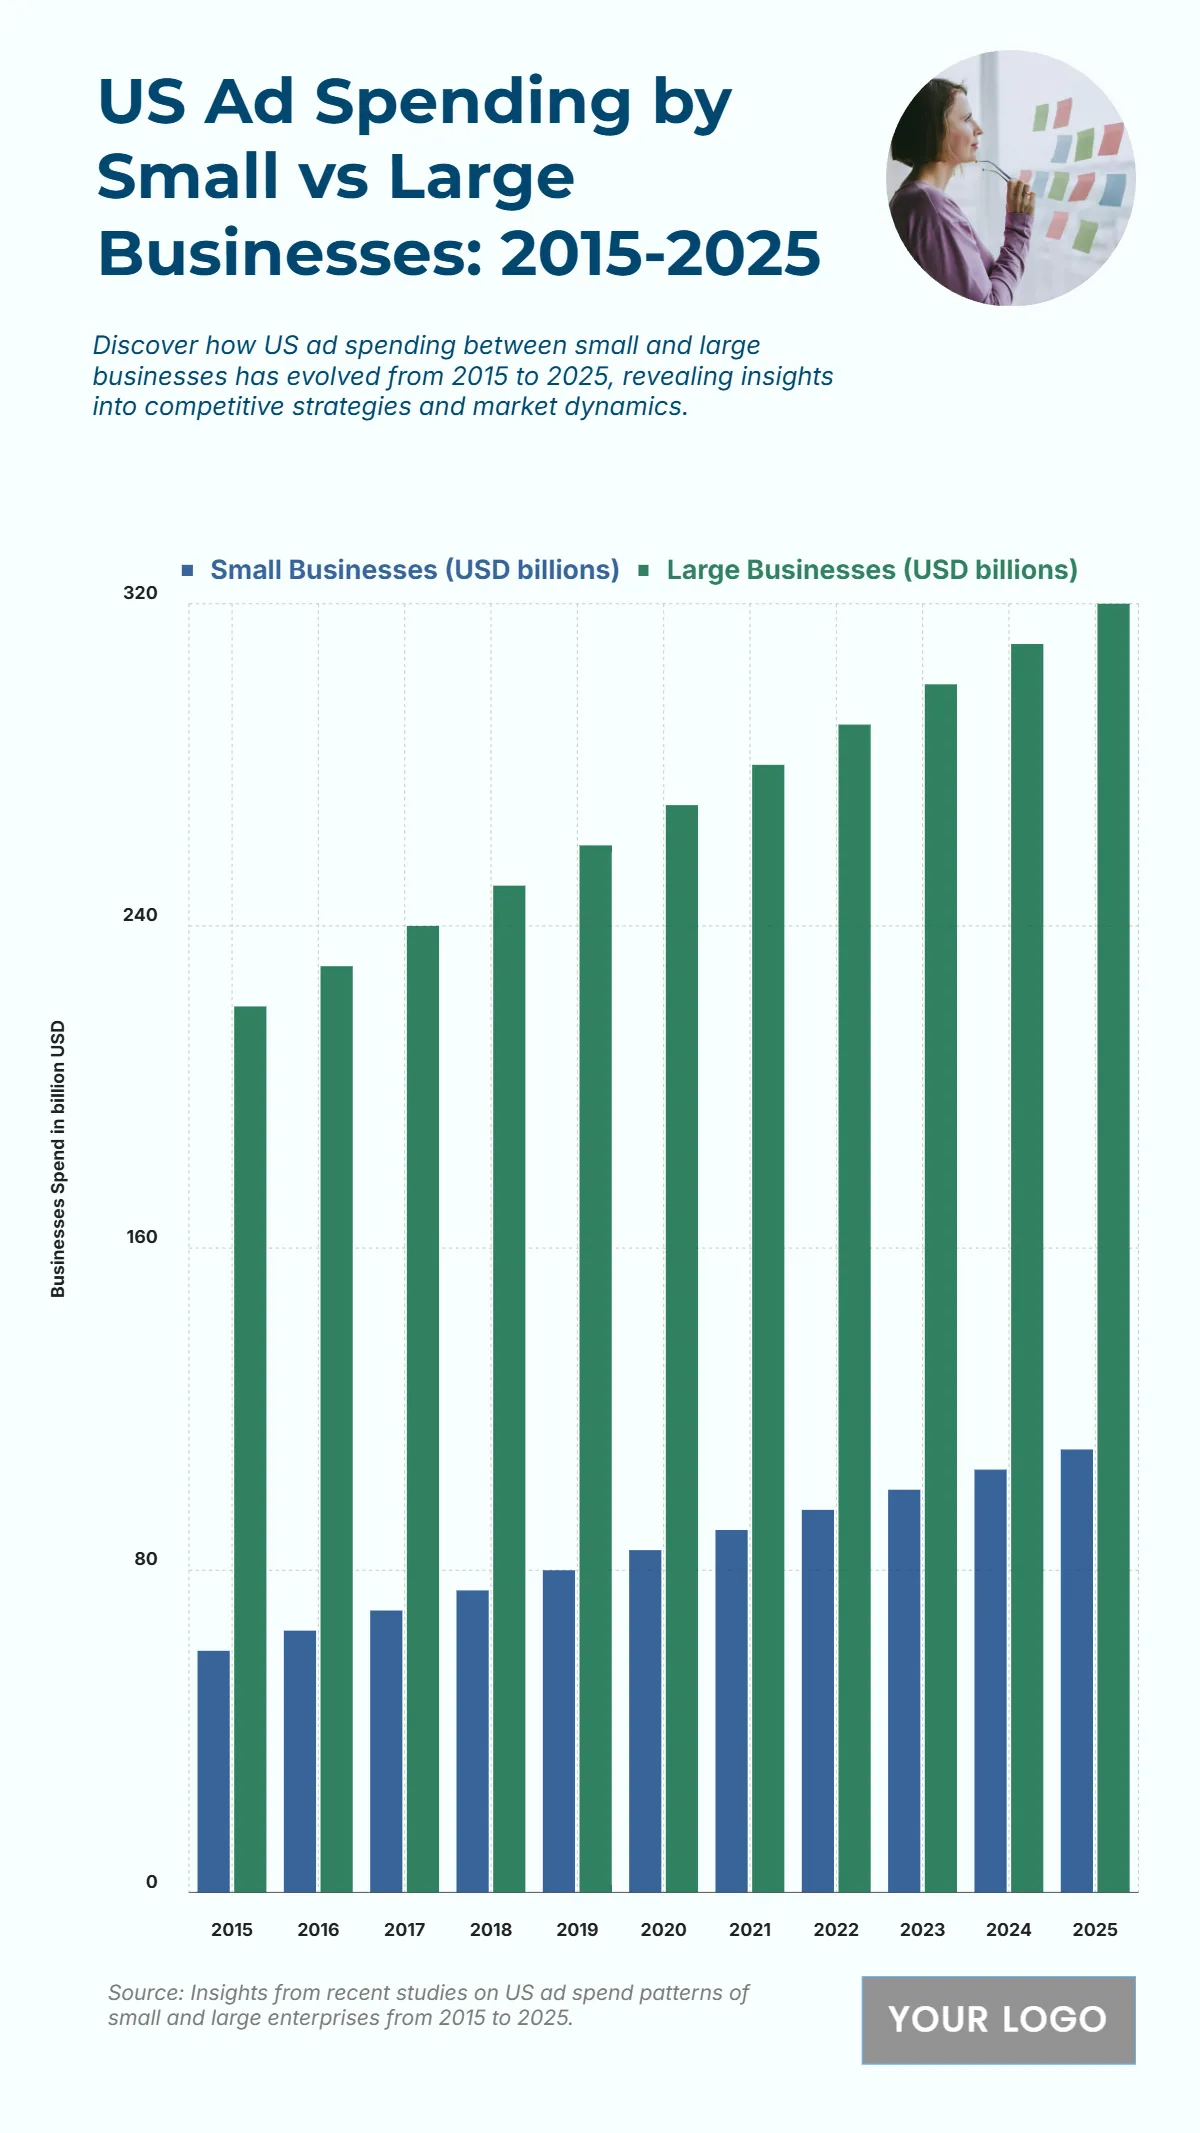
The chart depicts a major shift in ad spending patterns between small and large businesses over a decade. In 2015, small businesses spent USD 60 billion, while large businesses spent USD 98 billion. This gap remained stable through 2022, with small businesses increasing their spending to USD 95 billion, closely tracking large companies at USD 98 billion. However, from 2023 onwards, small business spending plummets to USD 10–11 billion, while large businesses maintain a steady USD 30–32 billion, suggesting a significant market contraction for small advertisers. This trend indicates a consolidation of digital ad dominance among large enterprises, likely due to resource advantages, better technology adoption, and resilience to market shifts.
| Labels | Small Businesses (USD billions) | Large Businesses (USD billions) |
|---|---|---|
| 2015 | 60 | 98 |
| 2016 | 65 | 88 |
| 2017 | 70 | 78 |
| 2018 | 75 | 85 |
| 2019 | 80 | 95 |
| 2020 | 85 | 90 |
| 2021 | 90 | 96 |
| 2022 | 95 | 98 |
| 2023 | 10 | 30 |
| 2024 | 10 | 31 |
| 2025 | 11 | 32 |


