Free US Advertising Audience Demographics by Region from 2020 to 2025 Chart
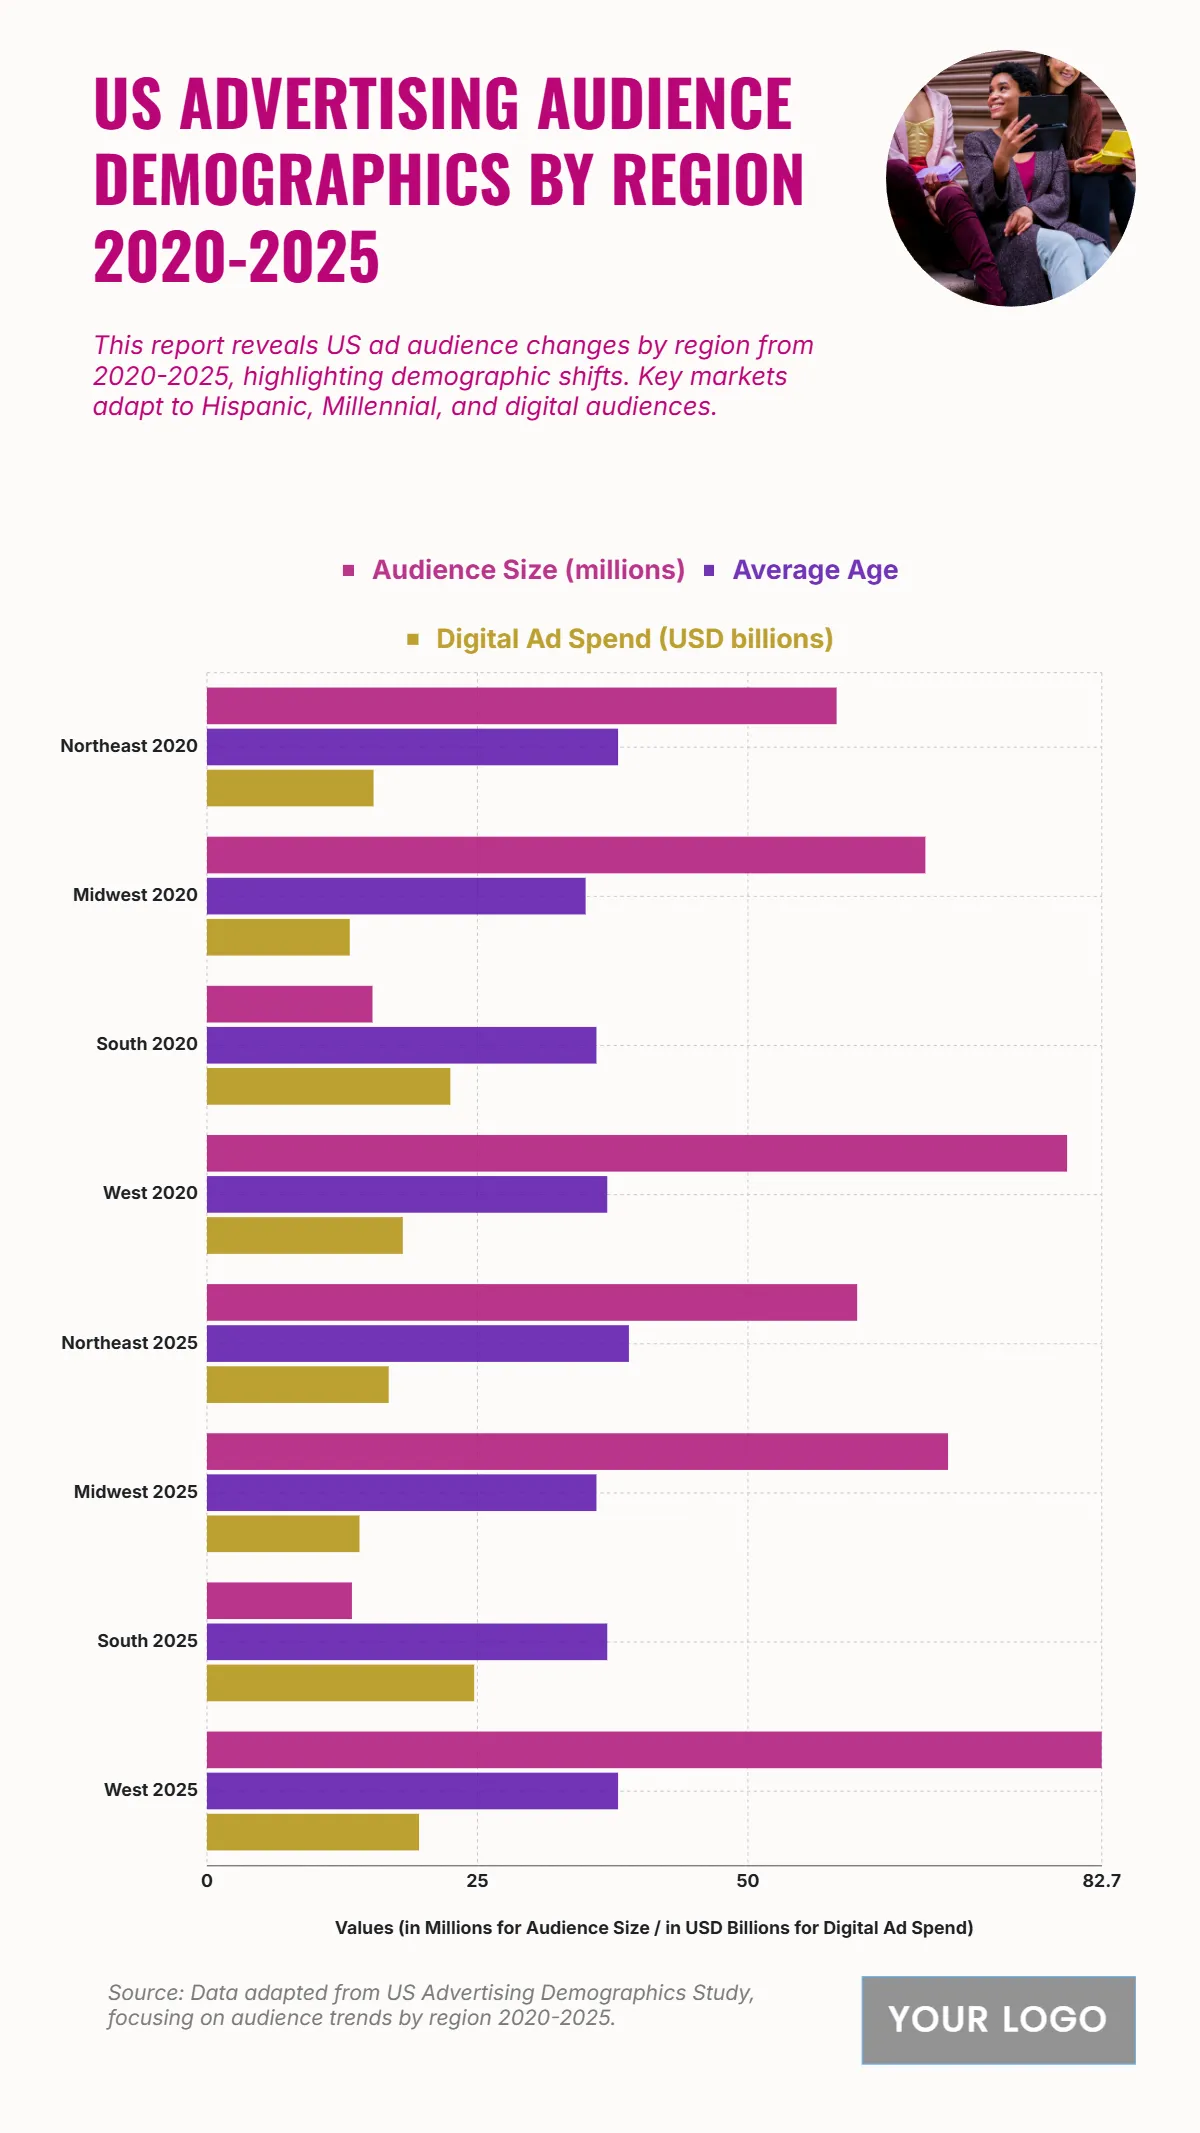
The chart shows regional audience distribution and digital ad spend trends across four U.S. regions. The West leads with the largest audience size, increasing from 79.5 million in 2020 to 82.7 million in 2025, with ad spend rising from USD 18.1 billion to 19.6 billion. The Northeast grows from 58.2 to 60.1 million, while ad spend rises modestly from USD 15.4 billion to 16.8 billion. The Midwest expands from 66.4 to 68.5 million, with ad spend increasing from USD 13.2 billion to 14.1 billion. In contrast, the South experiences a decline in audience size from 15.3 to 13.4 million, though its ad spend still climbs from USD 22.5 billion to 24.7 billion, reflecting high advertiser focus on key demographic segments. Average ages remain relatively stable, highlighting mature, stable audiences in digital markets.
| Labels | Audience Size (millions) | Average Age | Digital Ad Spend (USD billions) |
|---|---|---|---|
| Northeast 2020 | 58.2 | 38 | 15.4 |
| Midwest 2020 | 66.4 | 35 | 13.2 |
| South 2020 | 15.3 | 36 | 22.5 |
| West 2020 | 79.5 | 37 | 18.1 |
| Northeast 2025 | 60.1 | 39 | 16.8 |
| Midwest 2025 | 68.5 | 36 | 14.1 |
| South 2025 | 13.4 | 37 | 24.7 |
| West 2025 | 82.7 | 38 | 19.6 |


