Free US Mobile Ad Spend vs Desktop Ad Spend from 2015 to 2025 Chart
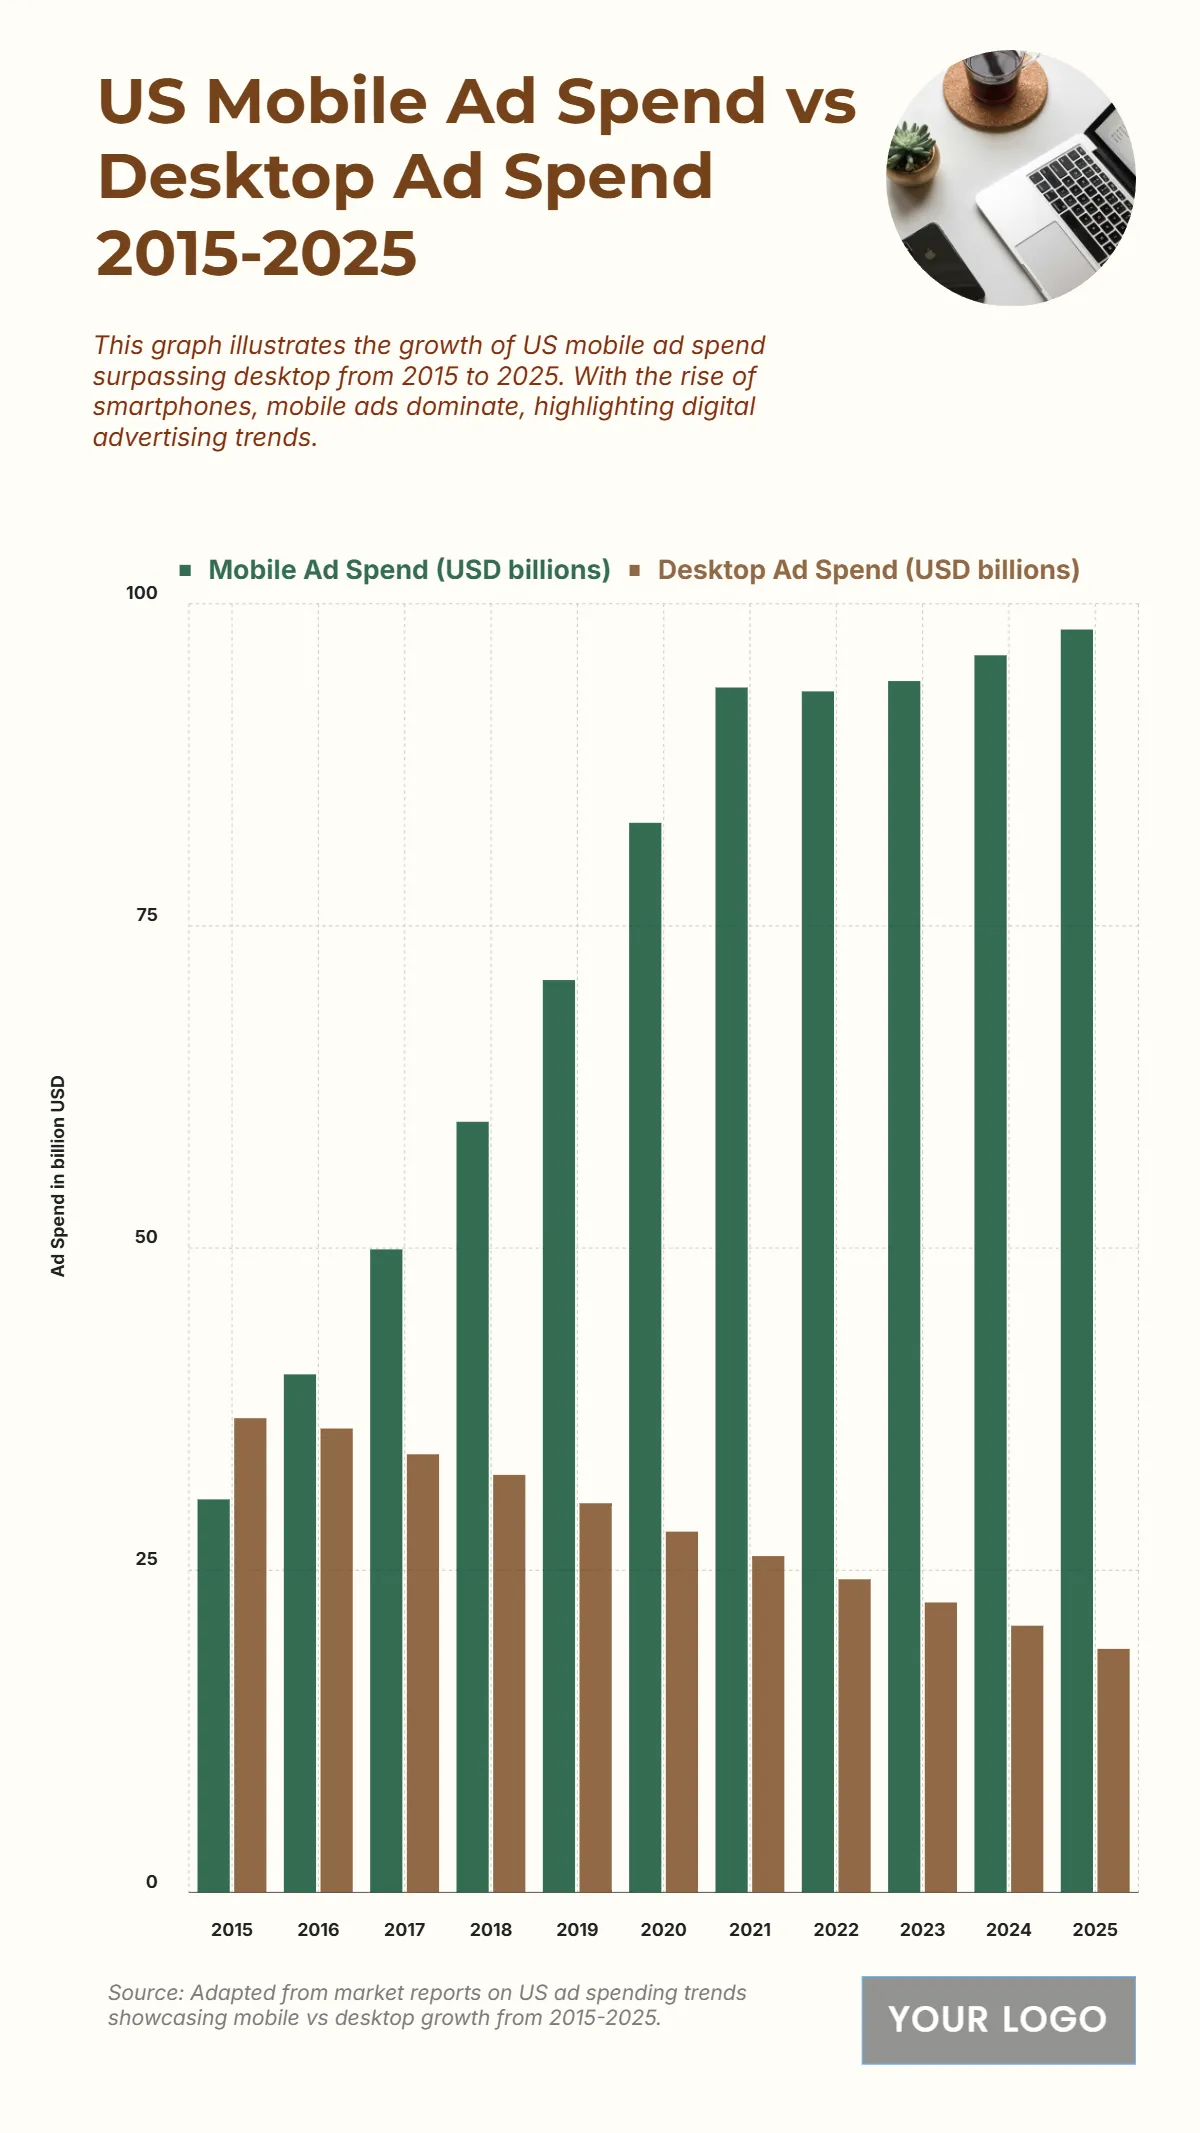
The chart illustrates a significant shift in ad spending from desktop to mobile between 2015 and 2025. Mobile ad spend surges from USD 30.5 billion in 2015 to USD 98 billion by 2025, reflecting a dramatic adoption of mobile-first advertising strategies. In contrast, desktop ad spend declines steadily from USD 36.8 billion to USD 18.9 billion over the same period. By 2019, mobile spend overtakes desktop, signaling a turning point in digital marketing trends. The growth remains strong throughout the 2020s, with mobile reaching USD 93.5 billion in 2021 and USD 96 billion in 2024, emphasizing the dominance of smartphones and in-app advertising. This trend aligns with changing user behaviors, as brands prioritize mobile engagement, personalization, and reach over traditional desktop campaigns.
| Labels | Mobile Ad Spend (USD billions) | Desktop Ad Spend (USD billions) |
|---|---|---|
| 2015 | 30.5 | 36.8 |
| 2016 | 40.2 | 36.0 |
| 2017 | 49.9 | 34.0 |
| 2018 | 59.8 | 32.4 |
| 2019 | 70.8 | 30.2 |
| 2020 | 83.0 | 28.0 |
| 2021 | 93.5 | 26.1 |
| 2022 | 93.2 | 24.3 |
| 2023 | 94.0 | 22.5 |
| 2024 | 96.0 | 20.7 |
| 2025 | 98.0 | 18.9 |


