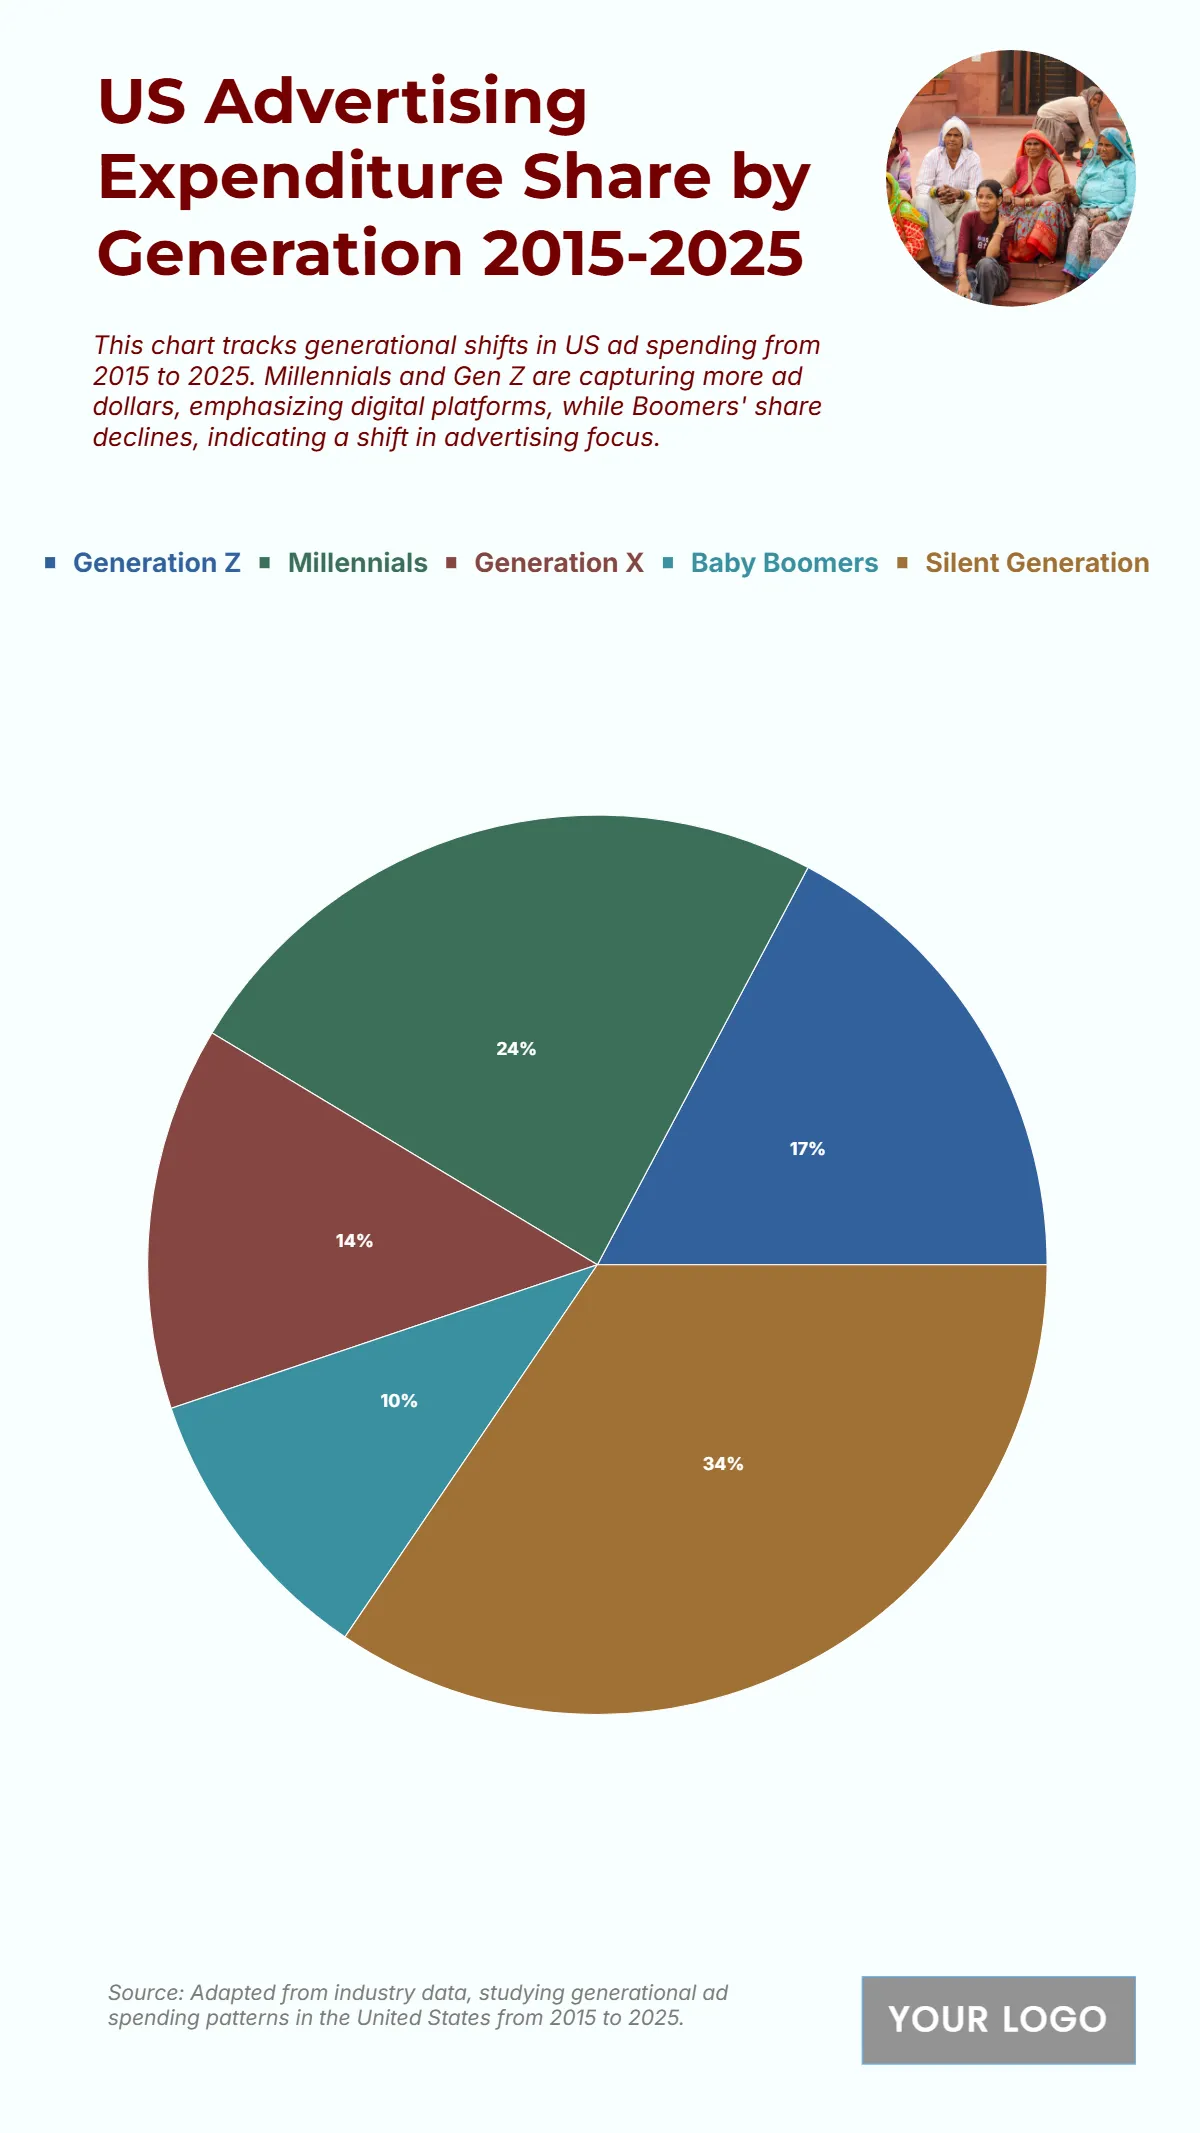
Free US Advertising Expenditure Share by Generation from 2015 to 2025 Chart
The chart demonstrates steady growth in connected TV ad impressions, highlighting the rise of streaming platforms in the advertising ecosystem. Impressions increase from around 25 billion in 2020 to over 45 billion in 2025, with notable yearly growth. By 2023, impressions surpass 40 billion, showing the impact of platforms like Roku, Amazon Fire, and Peacock. The upward trend reflects strong consumer migration to streaming TV and advertisers capitalizing on advanced targeting and engagement opportunities that CTV offers. This trajectory positions connected TV as a key driver of digital ad growth in the U.S.
| Labels | Total Impressions (Billions) 2020–2025 |
|---|---|
| 2025 | 47 |
| 2024 | 45 |
| 2023 | 41 |
| 2022 | 37 |
| 2021 | 33 |
| 2020 | 27 |
