Free US Real Estate Sector Advertising Expenditure from 2015 to 2025 Chart
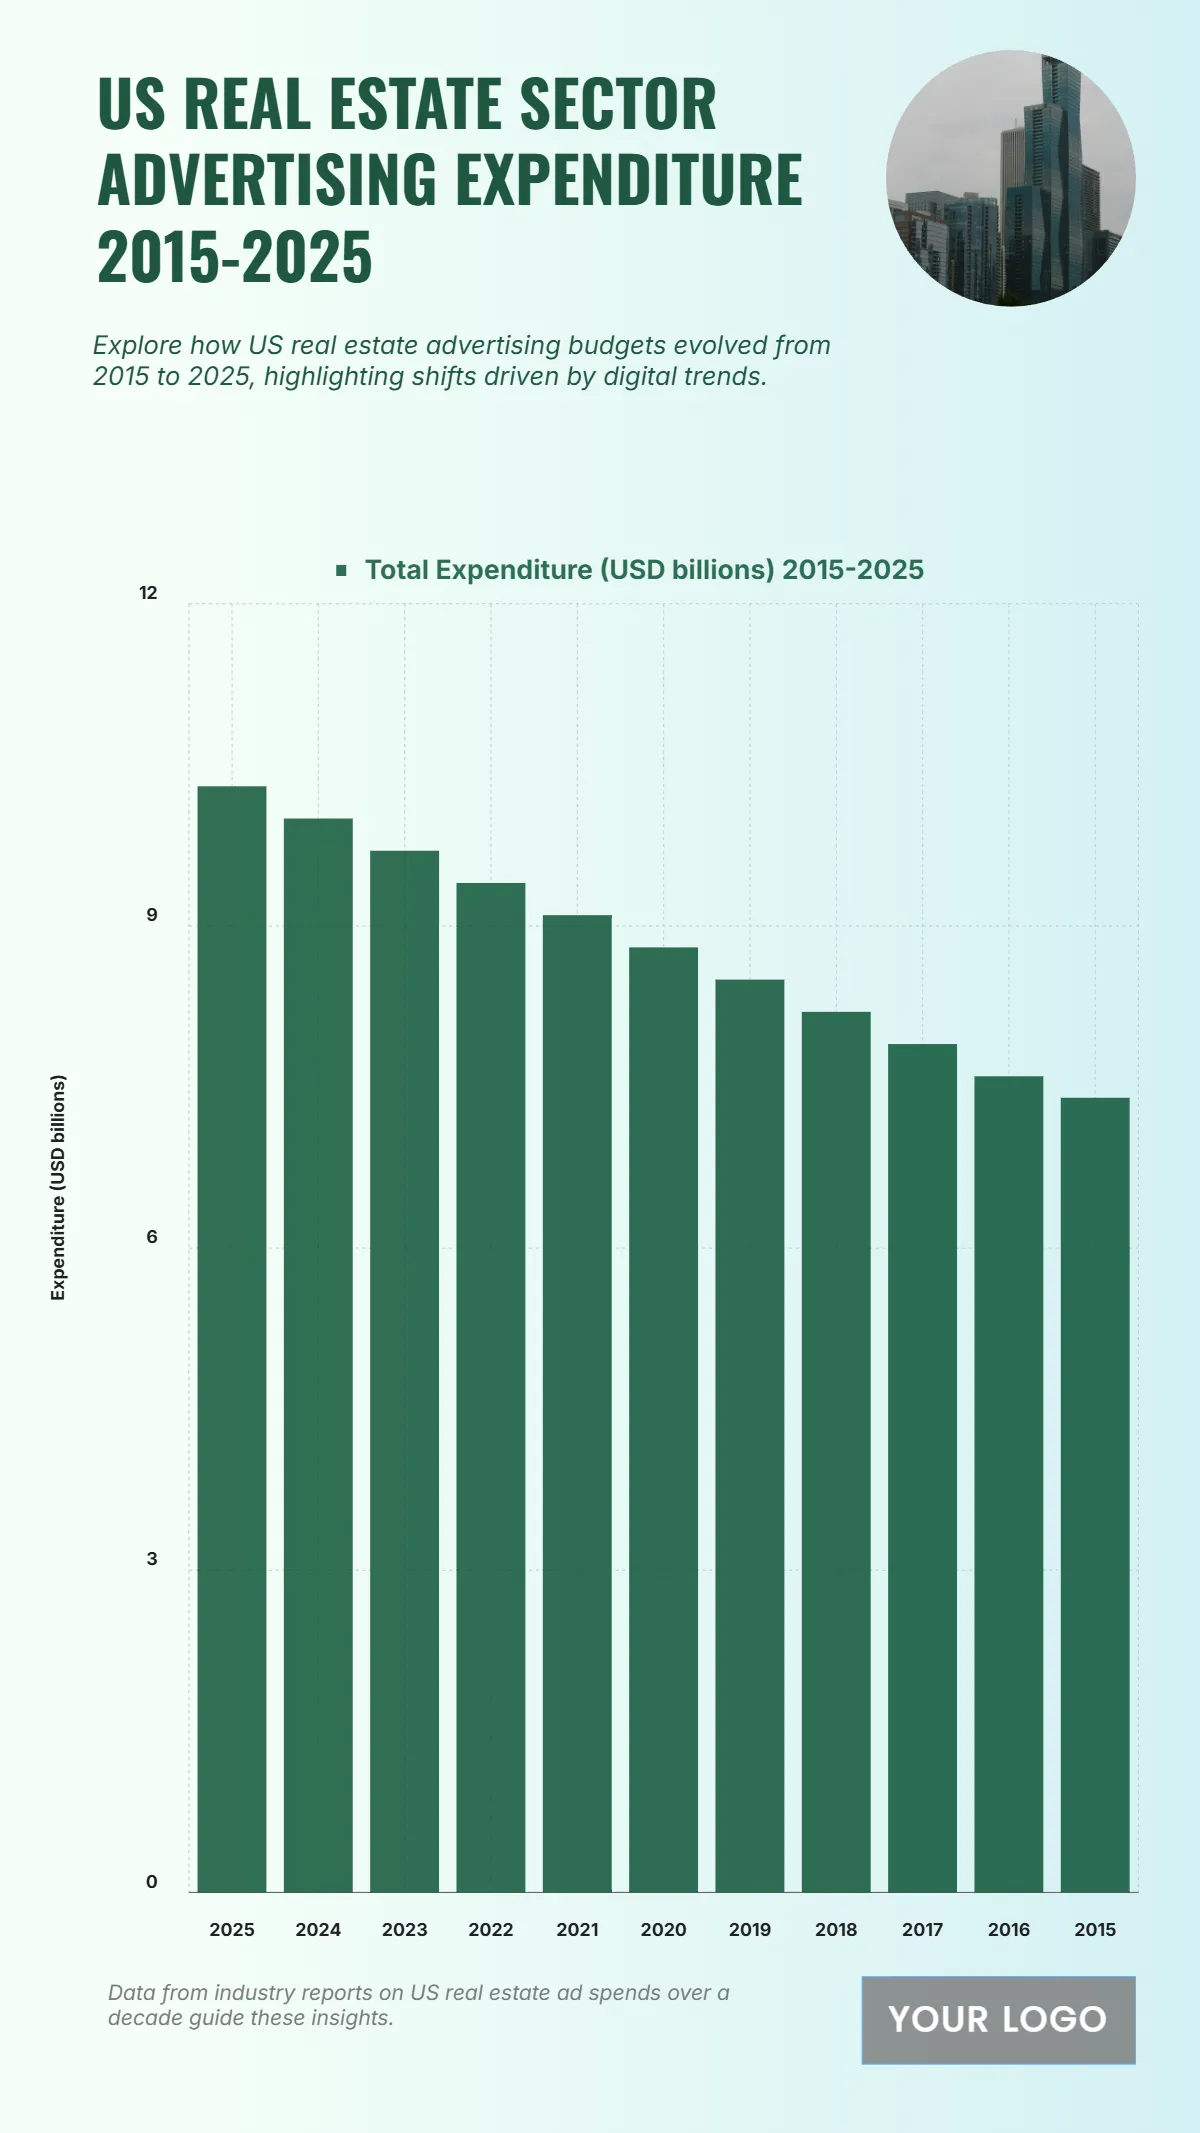
The US Real Estate sector's total advertising expenditure shows a clear and consistent increase from 2015 to 2025, driven by evolving digital trends and a growing market. In 2015, the total expenditure stood at USD 7.4 billion and is projected to reach USD 10.3 billion by 2025, indicating a growth of USD 2.9 billion over the decade. The spending grew steadily each year, with notable figures like USD 7.9 billion in 2017, USD 8.8 billion in 2020, and USD 9.7 billion in 2023. The trend suggests that real estate companies are increasingly allocating larger budgets to advertising campaigns, likely focusing on digital platforms to reach a broader audience, reflecting confidence and competition within the sector. The data underscores the critical role of advertising in the US real estate market's growth trajectory.
| Labels | Total Expenditure (USD billions) 2015-2025 |
| 2025 | 10.3 |
| 2024 | 10.0 |
| 2023 | 9.7 |
| 2022 | 9.4 |
| 2021 | 9.1 |
| 2020 | 8.8 |
| 2019 | 8.5 |
| 2018 | 8.2 |
| 2017 | 7.9 |
| 2016 | 7.6 |
| 2015 | 7.4 |


