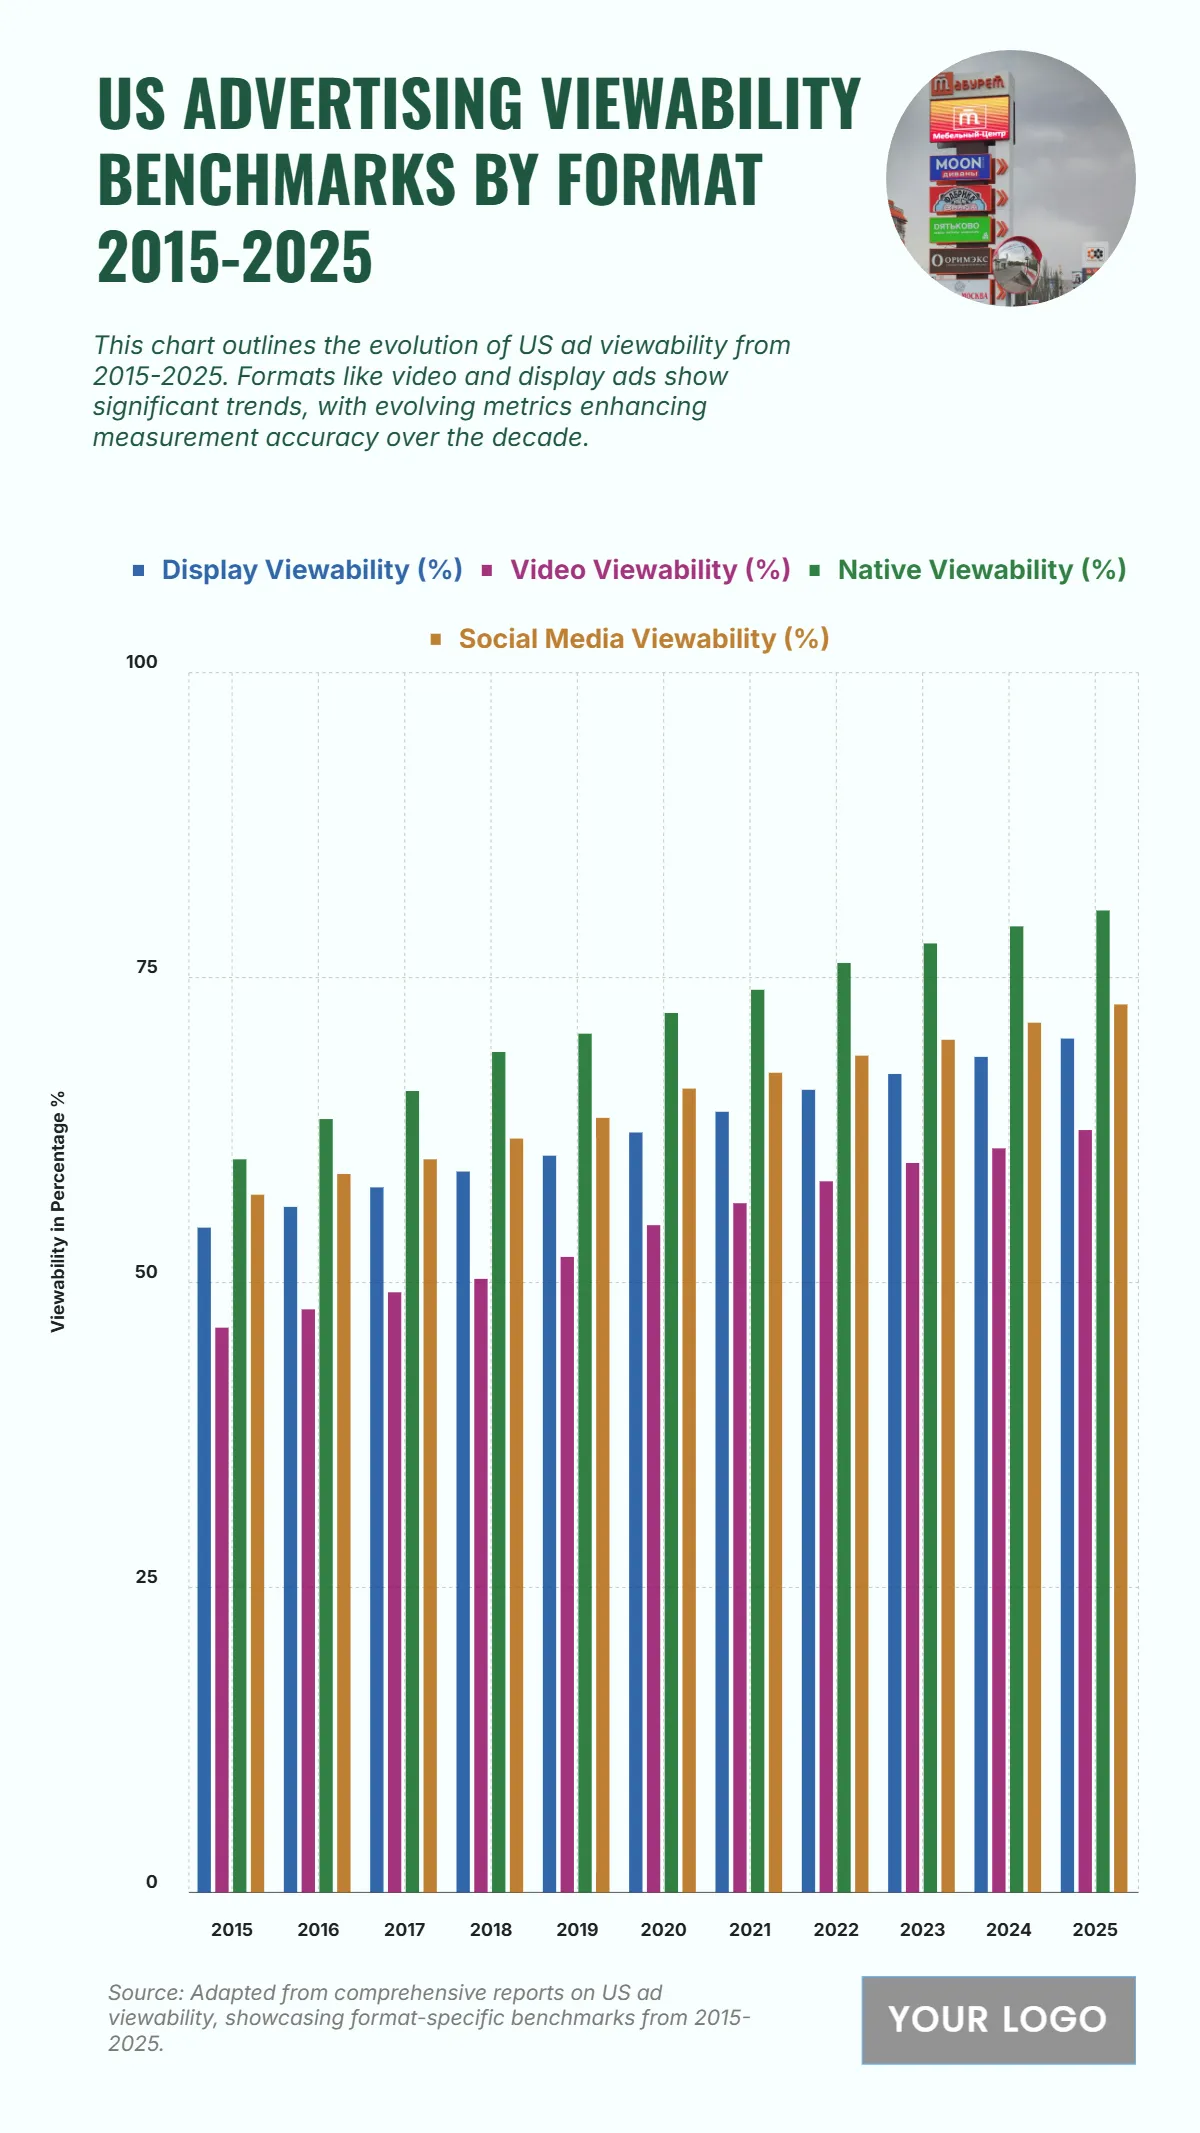
Free US Advertising Viewability Benchmarks by Format from 2015 to 2025 Chart
The US ad viewability across all formats—Display, Video, Native, and Social Media—experienced a significant upward trend from 2015 to 2025, reflecting enhanced measurement accuracy over the decade. Native Viewability (%) consistently maintained the highest viewability rate, starting at 60.1% in 2015 and projected to reach 80.5% by 2025, which represents an increase of $20.4$ percentage points. Display Viewability (%) saw its figures rise from 54.5% to 70.0% over the period. Video Viewability (%) showed the lowest starting point at 46.3% in 2015 but is projected to improve to 62.5% by 2025. Social Media Viewability (%) also demonstrated solid growth, beginning at 57.2% and increasing to 72.8% by the end of the period. This overall growth indicates improving standards and optimization within the digital advertising ecosystem.
| Labels | Display Viewability (%) | Video Viewability (%) | Native Viewability (%) | Social Media Viewability (%) |
| 2015 | 54.5 | 46.3 | 60.1 | 57.2 |
| 2016 | 56.2 | 47.8 | 63.4 | 58.9 |
| 2017 | 57.8 | 49.2 | 65.7 | 60.1 |
| 2018 | 59.1 | 50.3 | 68.9 | 61.8 |
| 2019 | 60.4 | 52.1 | 70.4 | 63.5 |
| 2020 | 62.3 | 54.7 | 72.1 | 65.9 |
| 2021 | 64.0 | 56.5 | 74.0 | 67.2 |
| 2022 | 65.8 | 58.3 | 76.2 | 68.6 |
| 2023 | 67.1 | 59.8 | 77.8 | 69.9 |
| 2024 | 68.5 | 61.0 | 79.2 | 71.3 |
| 2025 | 70.0 | 62.5 | 80.5 | 72.8 |


