Free US Advertising Spending in Rural vs Urban Markets from 2020 to 2025 Chart
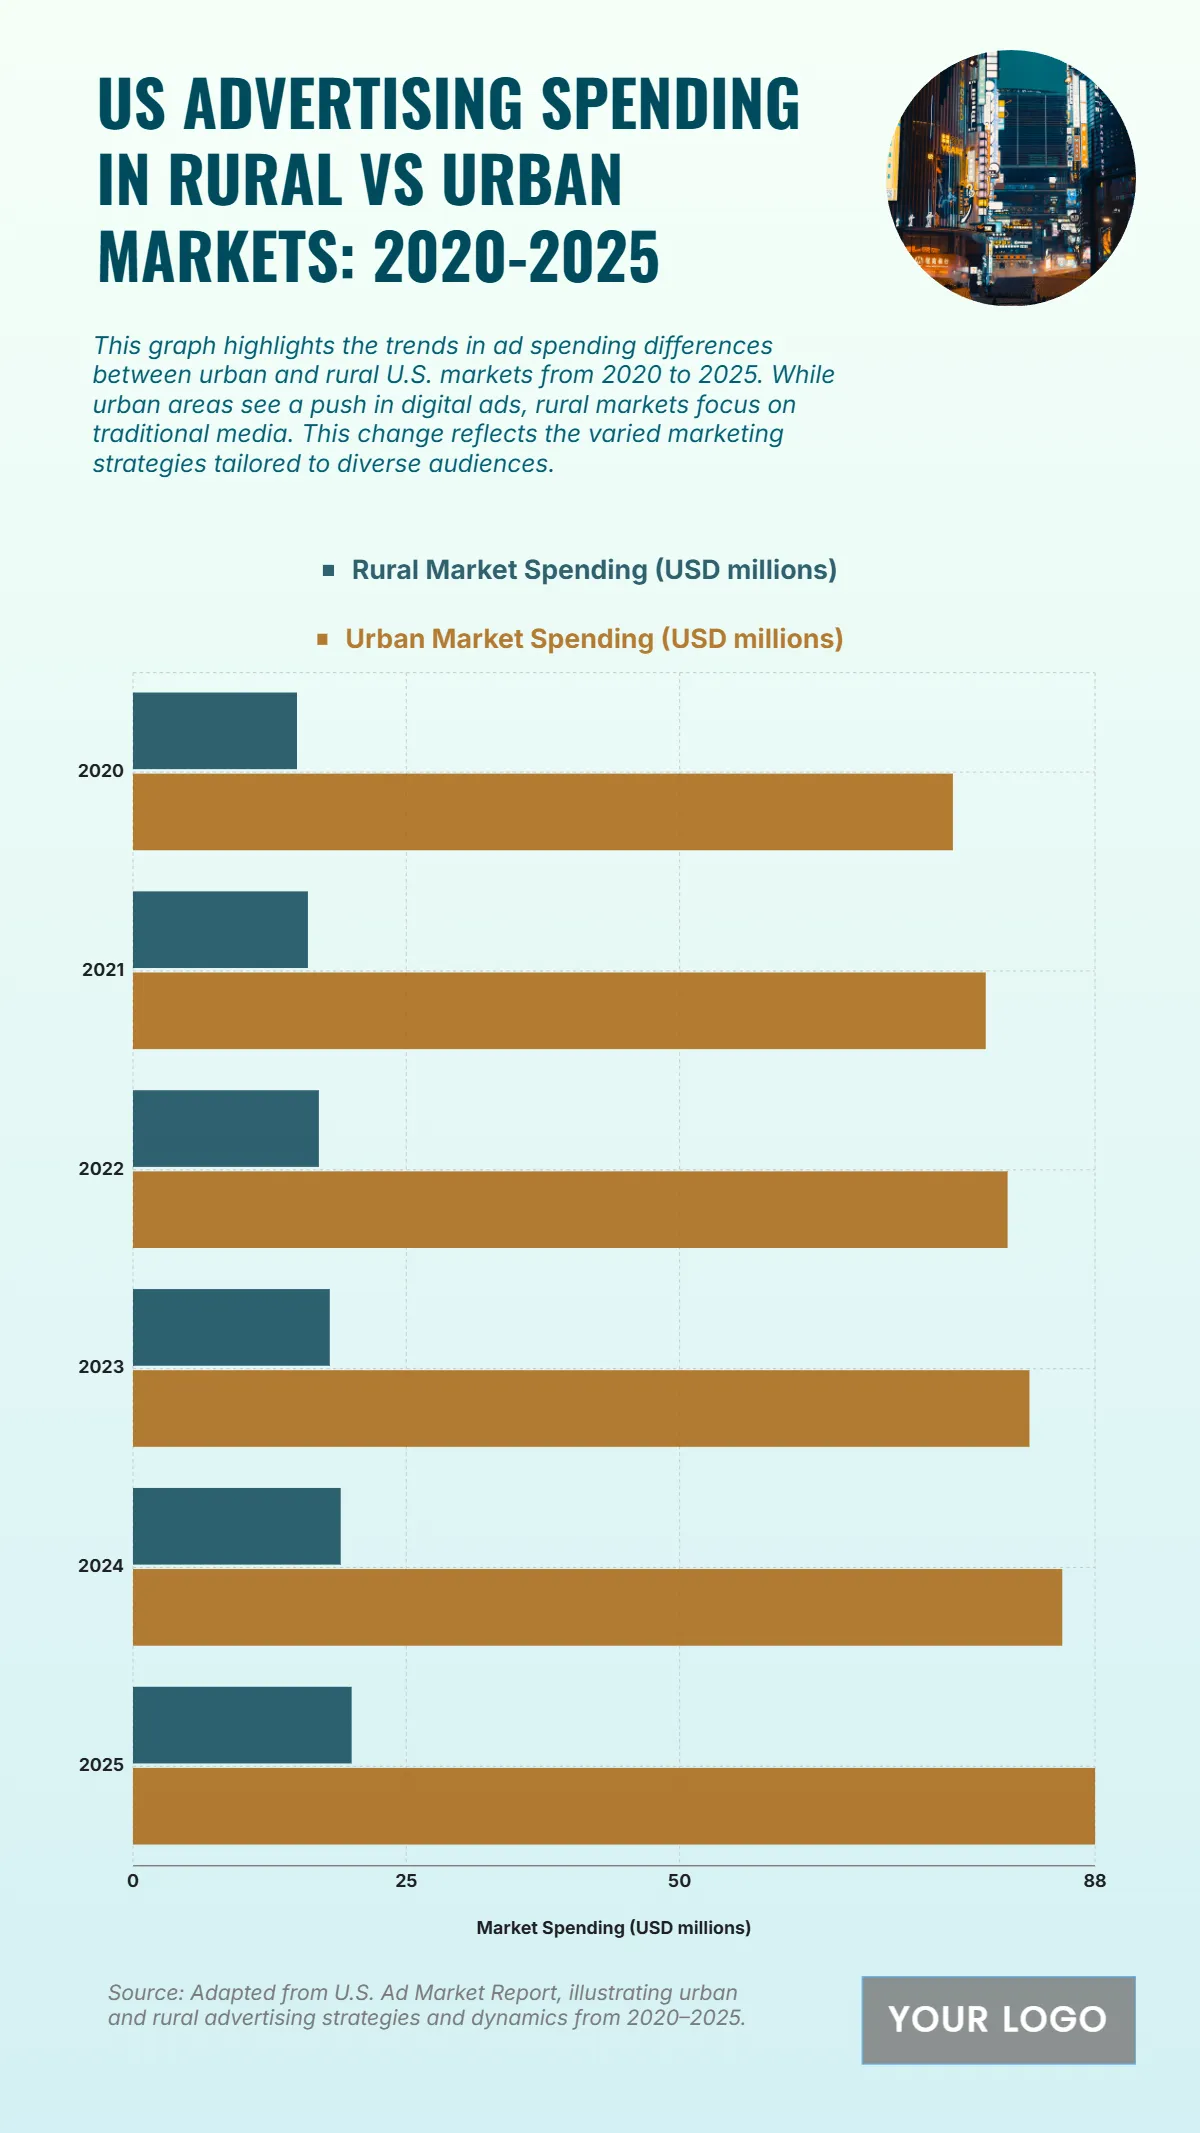
Advertising spending in the US shows a distinct and widening gap between Urban and Rural Markets from 2020 to 2025, with Urban markets commanding significantly larger budgets. Urban Market Spending started at USD 75 million in 2020 and is projected to increase to USD 88 million by 2025, representing an increase of USD 13 million. Conversely, Rural Market Spending is much lower, beginning at only USD 15 million in 2020 and modestly growing to USD 20 million by 2025. In 2023, the Urban market spent USD 82 million compared to the Rural market's USD 18 million. The overall trend indicates that while urban areas are heavily invested in digital ads, rural markets continue to focus on traditional media, leading to substantial differences in overall advertising expenditure across the two market types, with the Urban market spending being over four times that of the Rural market annually throughout the period.
| Labels | Rural Market Spending (USD millions) | Urban Market Spending (USD millions) |
| 2020 | 15 | 75 |
| 2021 | 16 | 78 |
| 2022 | 17 | 80 |
| 2023 | 18 | 82 |
| 2024 | 19 | 85 |
| 2025 | 20 | 88 |


