Free US Online Video Ad Completion Rate by Device from 2020 to 2025 Chart
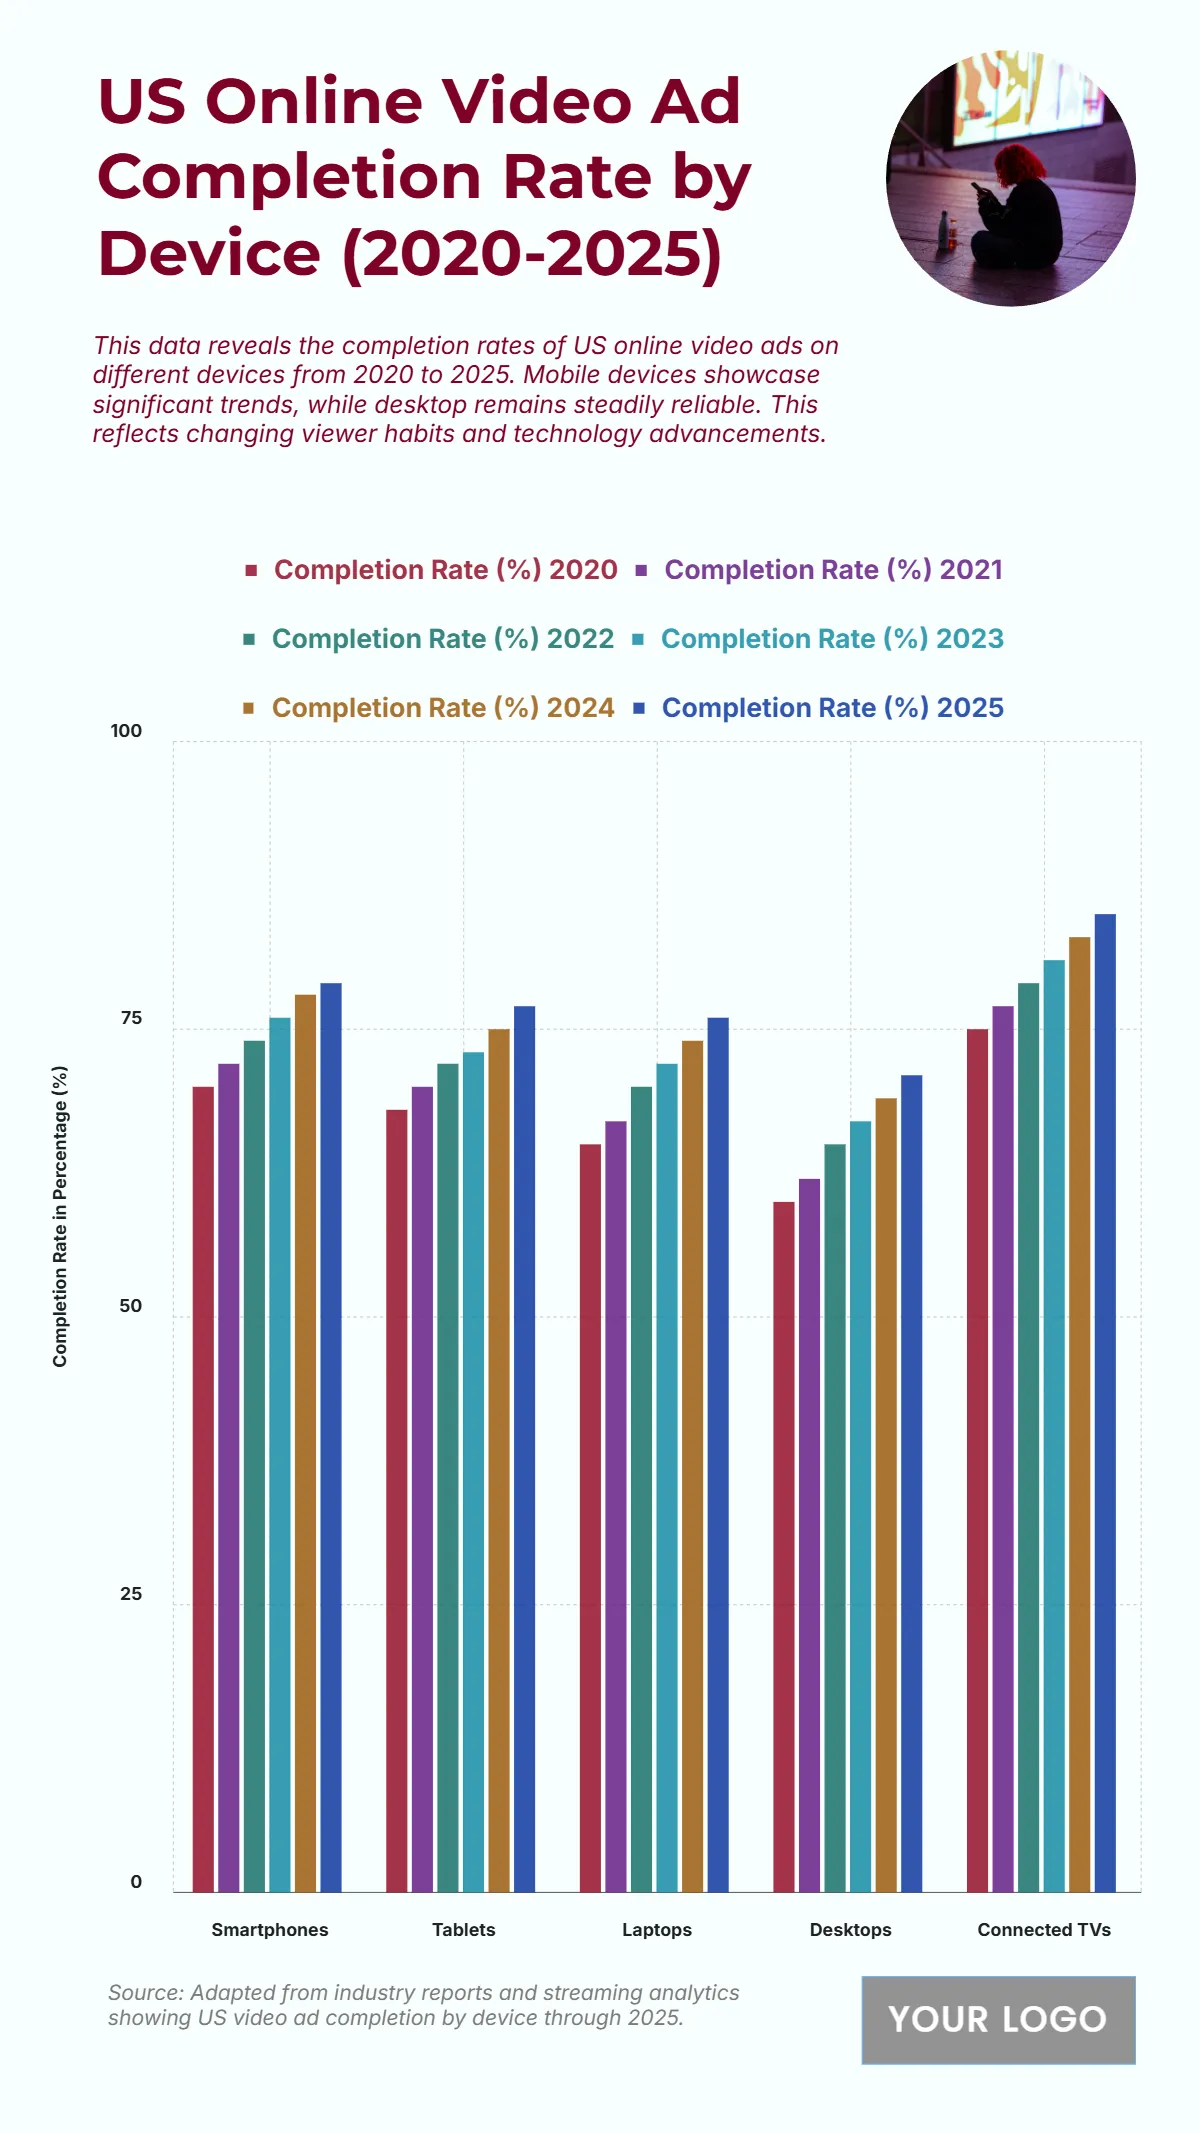
The completion rates for US online video ads demonstrate a consistent increase across all devices from 2020 to 2025, with Connected TVs leading the way in performance. Connected TVs are projected to have the highest completion rate by 2025 at 83%, showing a steady rise from 77% in 2020. Smartphones also show strong performance, increasing from 72% in 2020 to 78% in 2024. Tablets saw a rise from 70% in 2020 to 75% in 2024, and Laptops went from 67% to 74% in the same period. Desktops maintained the lowest, but still increasing, completion rates, going from 62% in 2020 to 69% in 2024. The data reflects changing viewer habits and technological advancements that favor larger screens like Connected TVs for ad completion, while mobile devices remain a strong platform.
| Device | Completion Rate (%) 2020 | Completion Rate (%) 2021 | Completion Rate (%) 2022 | Completion Rate (%) 2023 | Completion Rate (%) 2024 | Completion Rate (%) 2025 |
| Smartphones | 72 | 74 | 75 | 77 | 78 | 79 |
| Tablets | 70 | 72 | 73 | 74 | 75 | 76 |
| Laptops | 67 | 69 | 71 | 73 | 74 | 75 |
| Desktops | 62 | 64 | 66 | 68 | 69 | 70 |
| Connected TVs | 77 | 79 | 80 | 82 | 83 | 84 |


