Free US Social Media Video Ad Completion Rate from 2015 to 2025 Chart
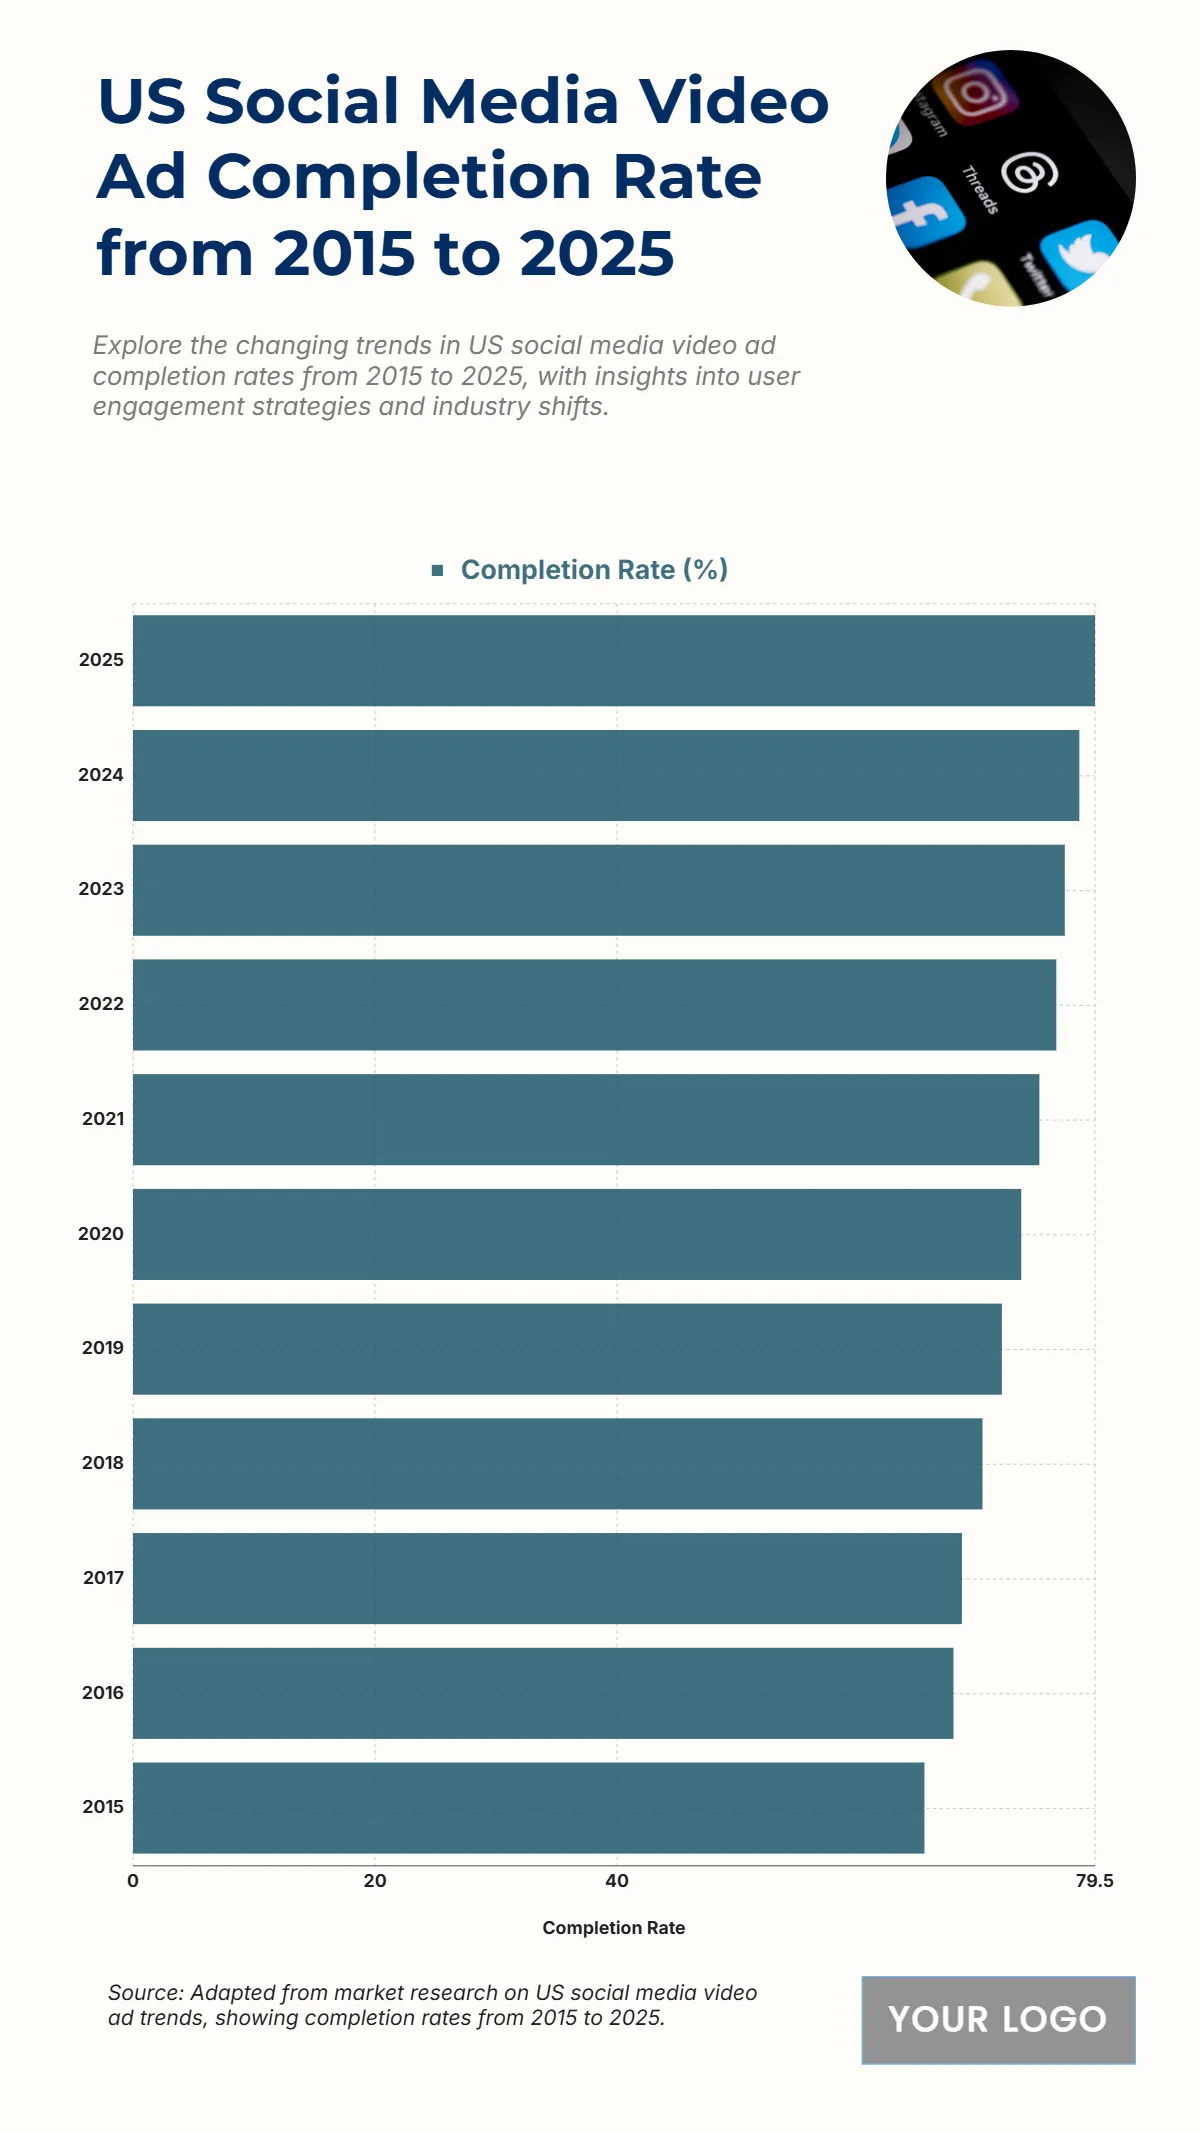
The chart shows a steady rise in US social media video ad completion rates from 2015 to 2025, reflecting improved engagement strategies and ad formats. Starting at 65.4% in 2015, completion rates gradually increased to 67.8% in 2016, 70.2% in 2018, and 73.4% in 2020, indicating the growing effectiveness of video campaigns. The upward trend continues with 76.3% in 2022 and 78.2% in 2024, reaching 79.5% in 2025, which marks the highest recorded rate. This consistent growth highlights the evolution of audience behavior, with viewers increasingly completing video ads as platforms optimize content delivery, personalization, and targeting strategies to maintain attention and reduce drop-off rates.
| Labels | Completion Rate (%) |
|---|---|
| 2025 | 79.5 |
| 2024 | 78.2 |
| 2023 | 77 |
| 2022 | 76.3 |
| 2021 | 74.9 |
| 2020 | 73.4 |
| 2019 | 71.8 |
| 2018 | 70.2 |
| 2017 | 68.5 |
| 2016 | 67.8 |
| 2015 | 65.4 |


