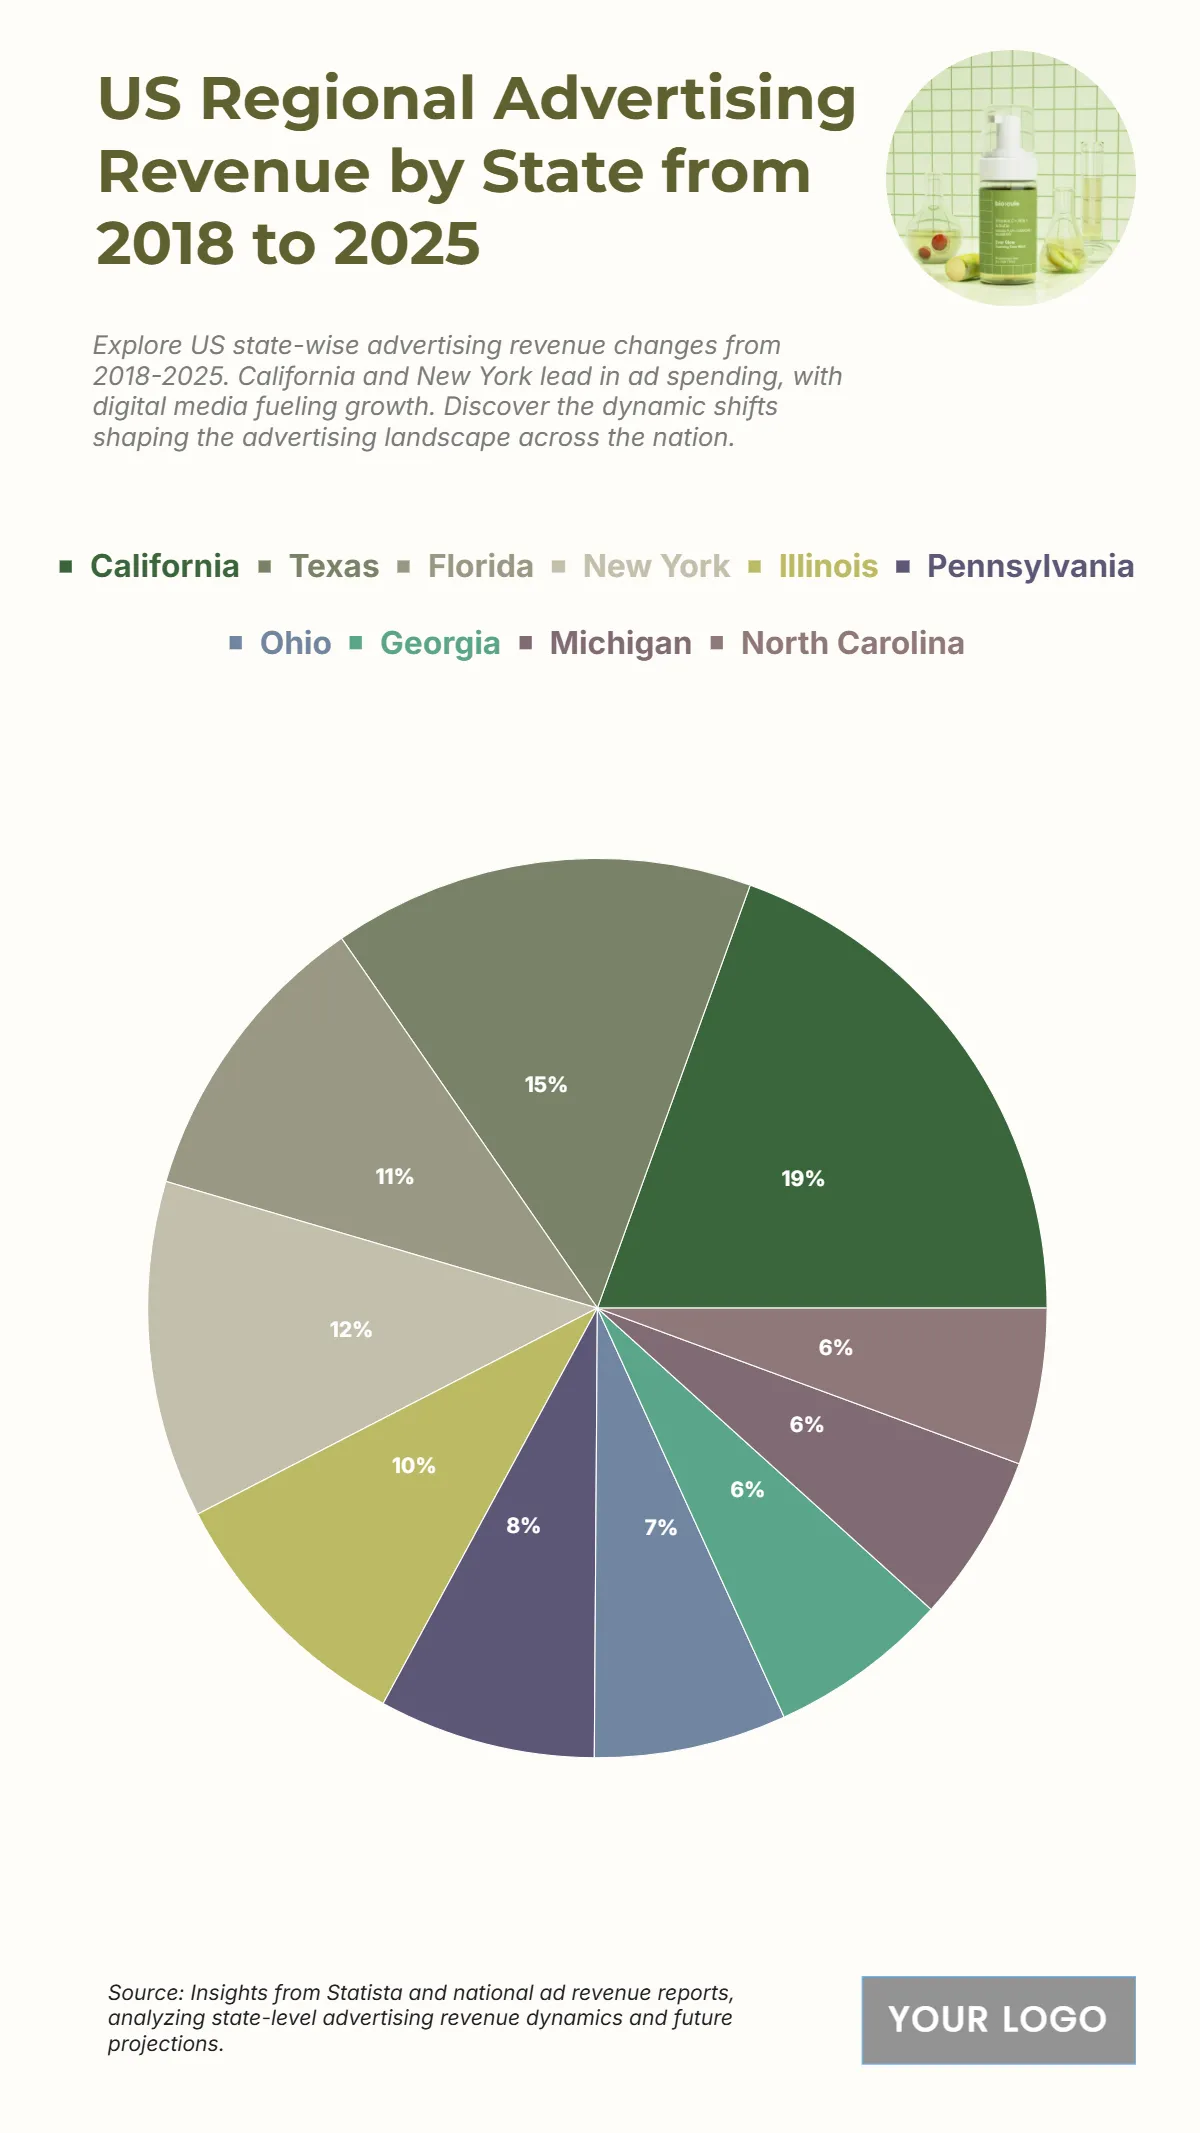
Free US Regional Advertising Revenue by State from 2018 to 2025 Chart
The chart reveals that California leads US regional advertising revenue from 2018 to 2025, reaching 450 billion USD, followed by Texas with 350 billion USD and New York at 280 billion USD. **Florida and **Illinois also record high totals at 250 and 220 billion USD. Mid-range states such as Pennsylvania and Ohio fall between 160 and 180 billion USD, while Georgia, Michigan, and North Carolina complete the top 10. This distribution reflects how advertising revenue remains heavily concentrated in large and economically dynamic states, particularly those with strong tech, retail, and media sectors.
| Labels | 2018–2025 Total Revenue (in billions) |
|---|---|
| California | 450 |
| Texas | 350 |
| Florida | 250 |
| New York | 280 |
| Illinois | 220 |
| Pennsylvania | 180 |
| Ohio | 160 |
| Georgia | 150 |
| Michigan | 140 |
| North Carolina | 130 |


