Free US Retail Sales Conversion by Traffic Source from 2015 to 2025 Chart
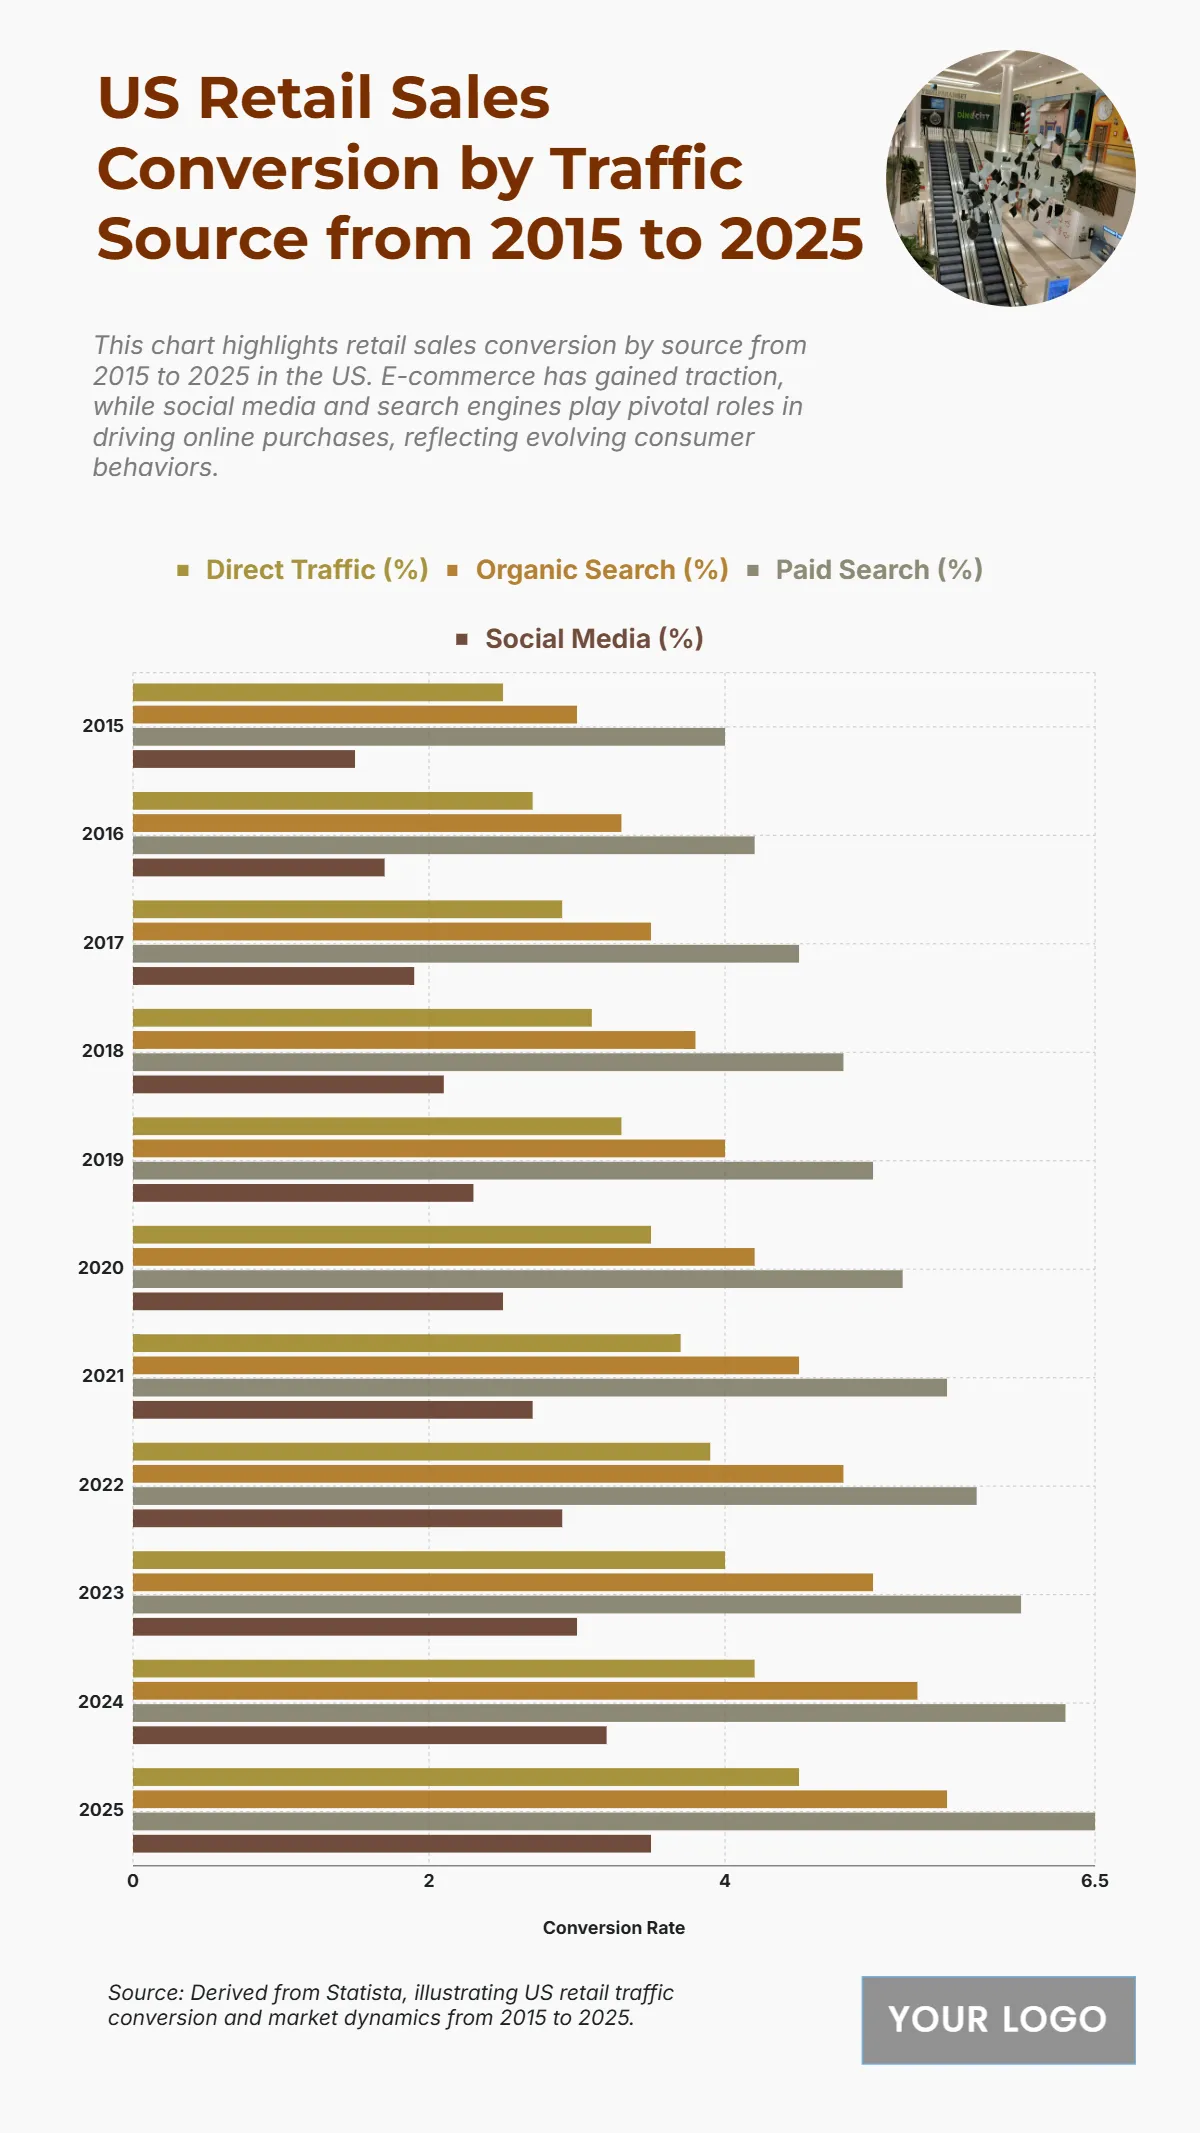
The chart displays a steady rise in retail sales conversion rates from multiple traffic sources between 2015 and 2025. Paid search leads consistently, increasing from 4% in 2015 to 6.5% in 2025, while organic search follows, rising from 3% to 5.5%. Direct traffic grows from 2.5% to 4.5%, highlighting more effective brand-driven visits. Social media conversions, though the lowest, show notable gains—from 1.5% in 2015 to 3.5% in 2025, illustrating its strengthening role in e-commerce. The upward trend across all channels emphasizes a more competitive digital landscape, with search and paid channels continuing to dominate conversion performance.
| Labels | Direct Traffic (%) | Organic Search (%) | Paid Search (%) | Social Media (%) |
|---|---|---|---|---|
| 2015 | 2.5 | 3.0 | 4.0 | 1.5 |
| 2016 | 2.7 | 3.3 | 4.2 | 1.7 |
| 2017 | 2.9 | 3.5 | 4.5 | 1.9 |
| 2018 | 3.1 | 3.8 | 4.8 | 2.1 |
| 2019 | 3.3 | 4.0 | 5.0 | 2.3 |
| 2020 | 3.5 | 4.2 | 5.2 | 2.5 |
| 2021 | 3.7 | 4.5 | 5.5 | 2.7 |
| 2022 | 3.9 | 4.8 | 5.7 | 2.9 |
| 2023 | 4.0 | 5.0 | 6.0 | 3.0 |
| 2024 | 4.2 | 5.3 | 6.3 | 3.2 |
| 2025 | 4.5 | 5.5 | 6.5 | 3.5 |


