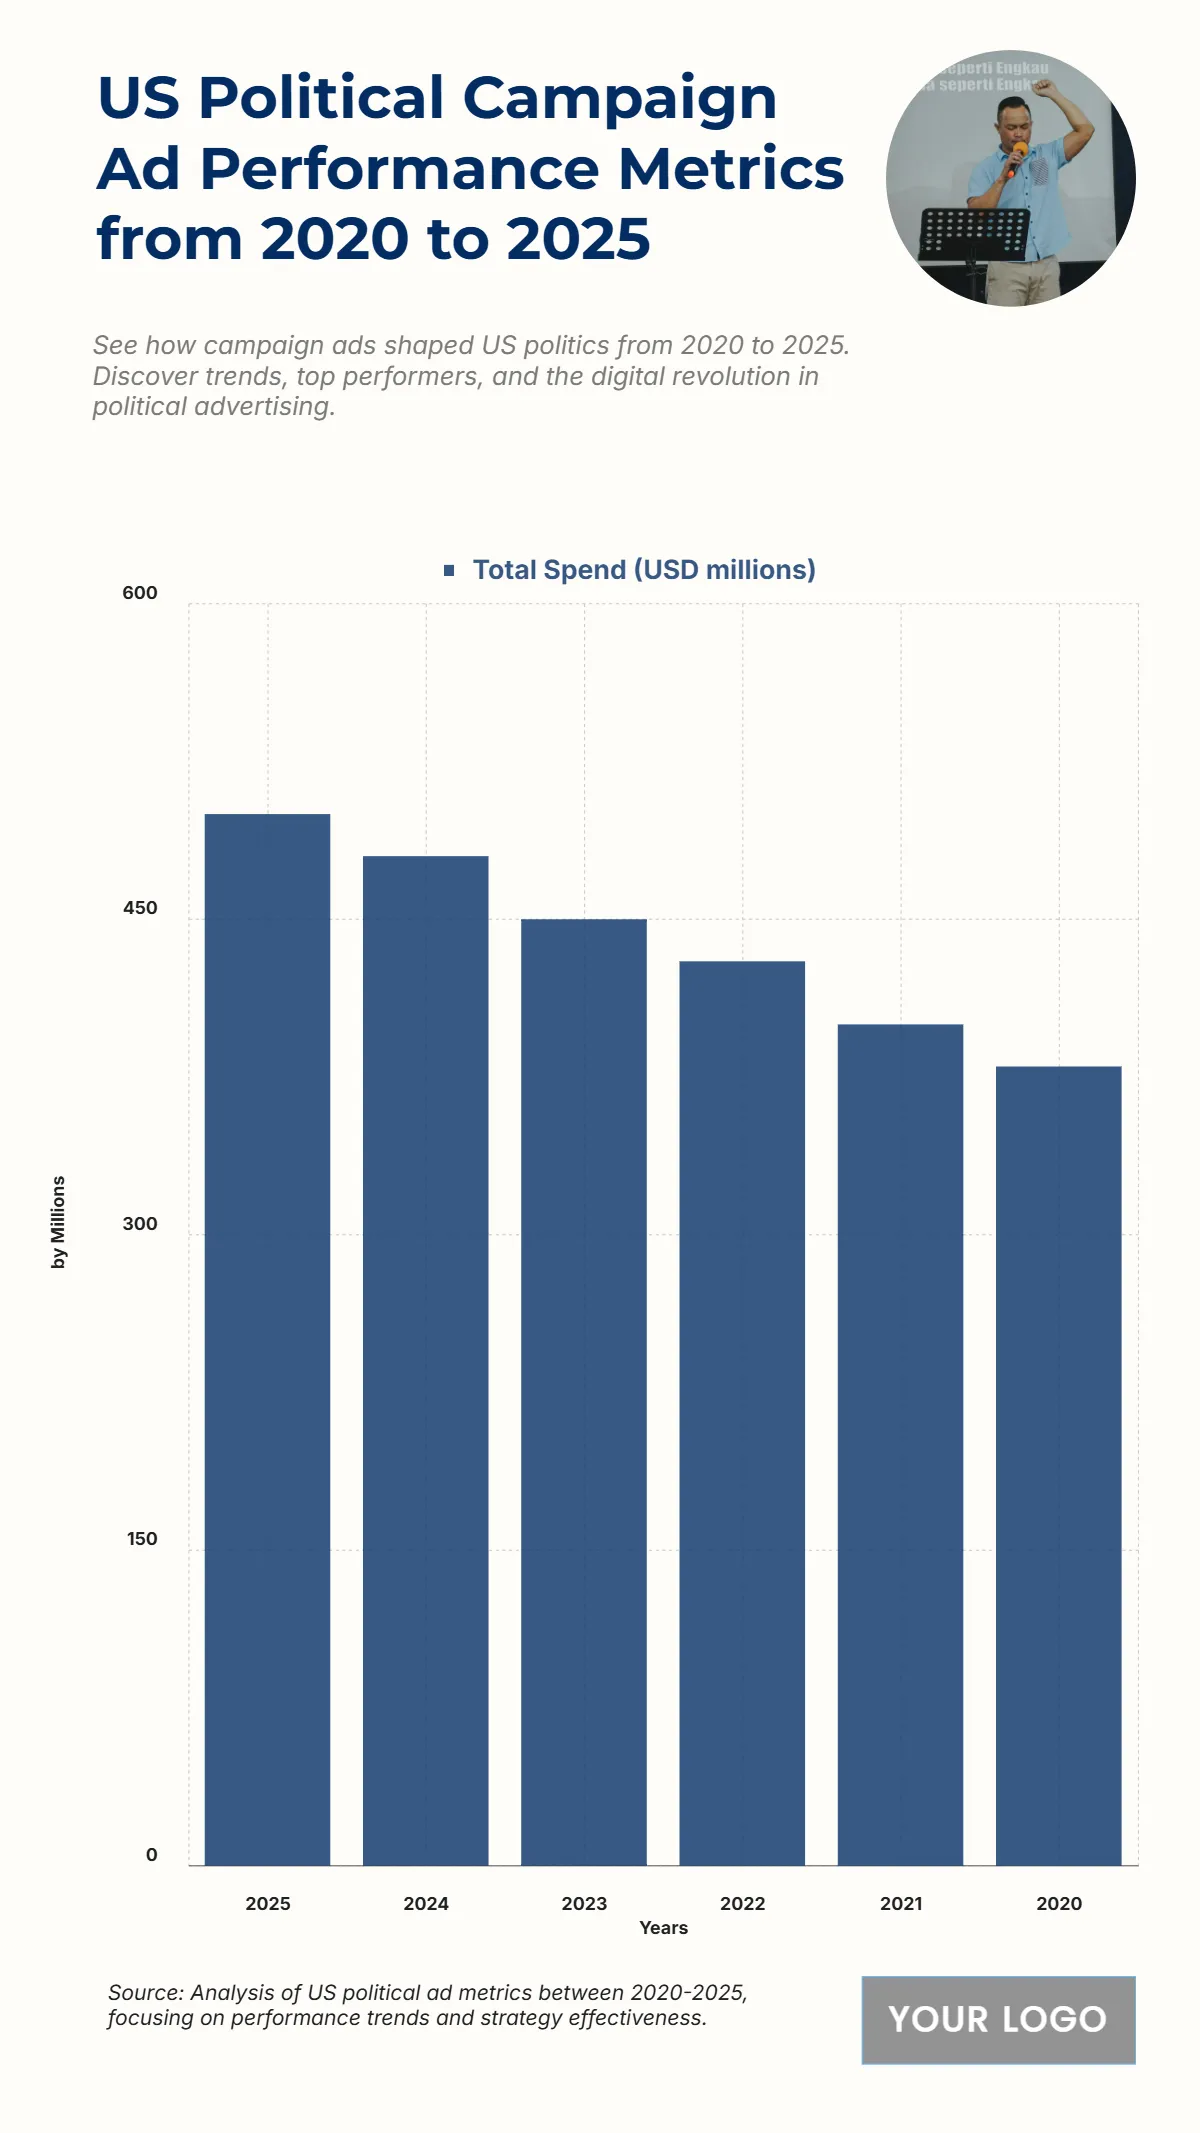
Free US Political Campaign Ad Performance Metrics from 2020 to 2025 Chart
The chart shows a steady increase in political campaign ad spend in the US between 2020 and 2025, indicating a growing focus on digital and media outreach strategies. Spending rose from 380 million USD in 2020 to 400 million USD in 2021, and 430 million USD in 2022. It continued to grow with 450 million USD in 2023 and 480 million USD in 2024, reaching 500 million USD in 2025, the highest during the period. This upward trajectory highlights the intensifying role of advertising in political campaigns, as candidates and organizations increase investments to influence voter behavior and maximize reach during election cycles.
| Labels | Total Spend (USD millions) |
|---|---|
| 2025 | 500 |
| 2024 | 480 |
| 2023 | 450 |
| 2022 | 430 |
| 2021 | 400 |
| 2020 | 380 |


