Free US E-commerce Purchase Frequency by Category from 2015 to 2025 Chart
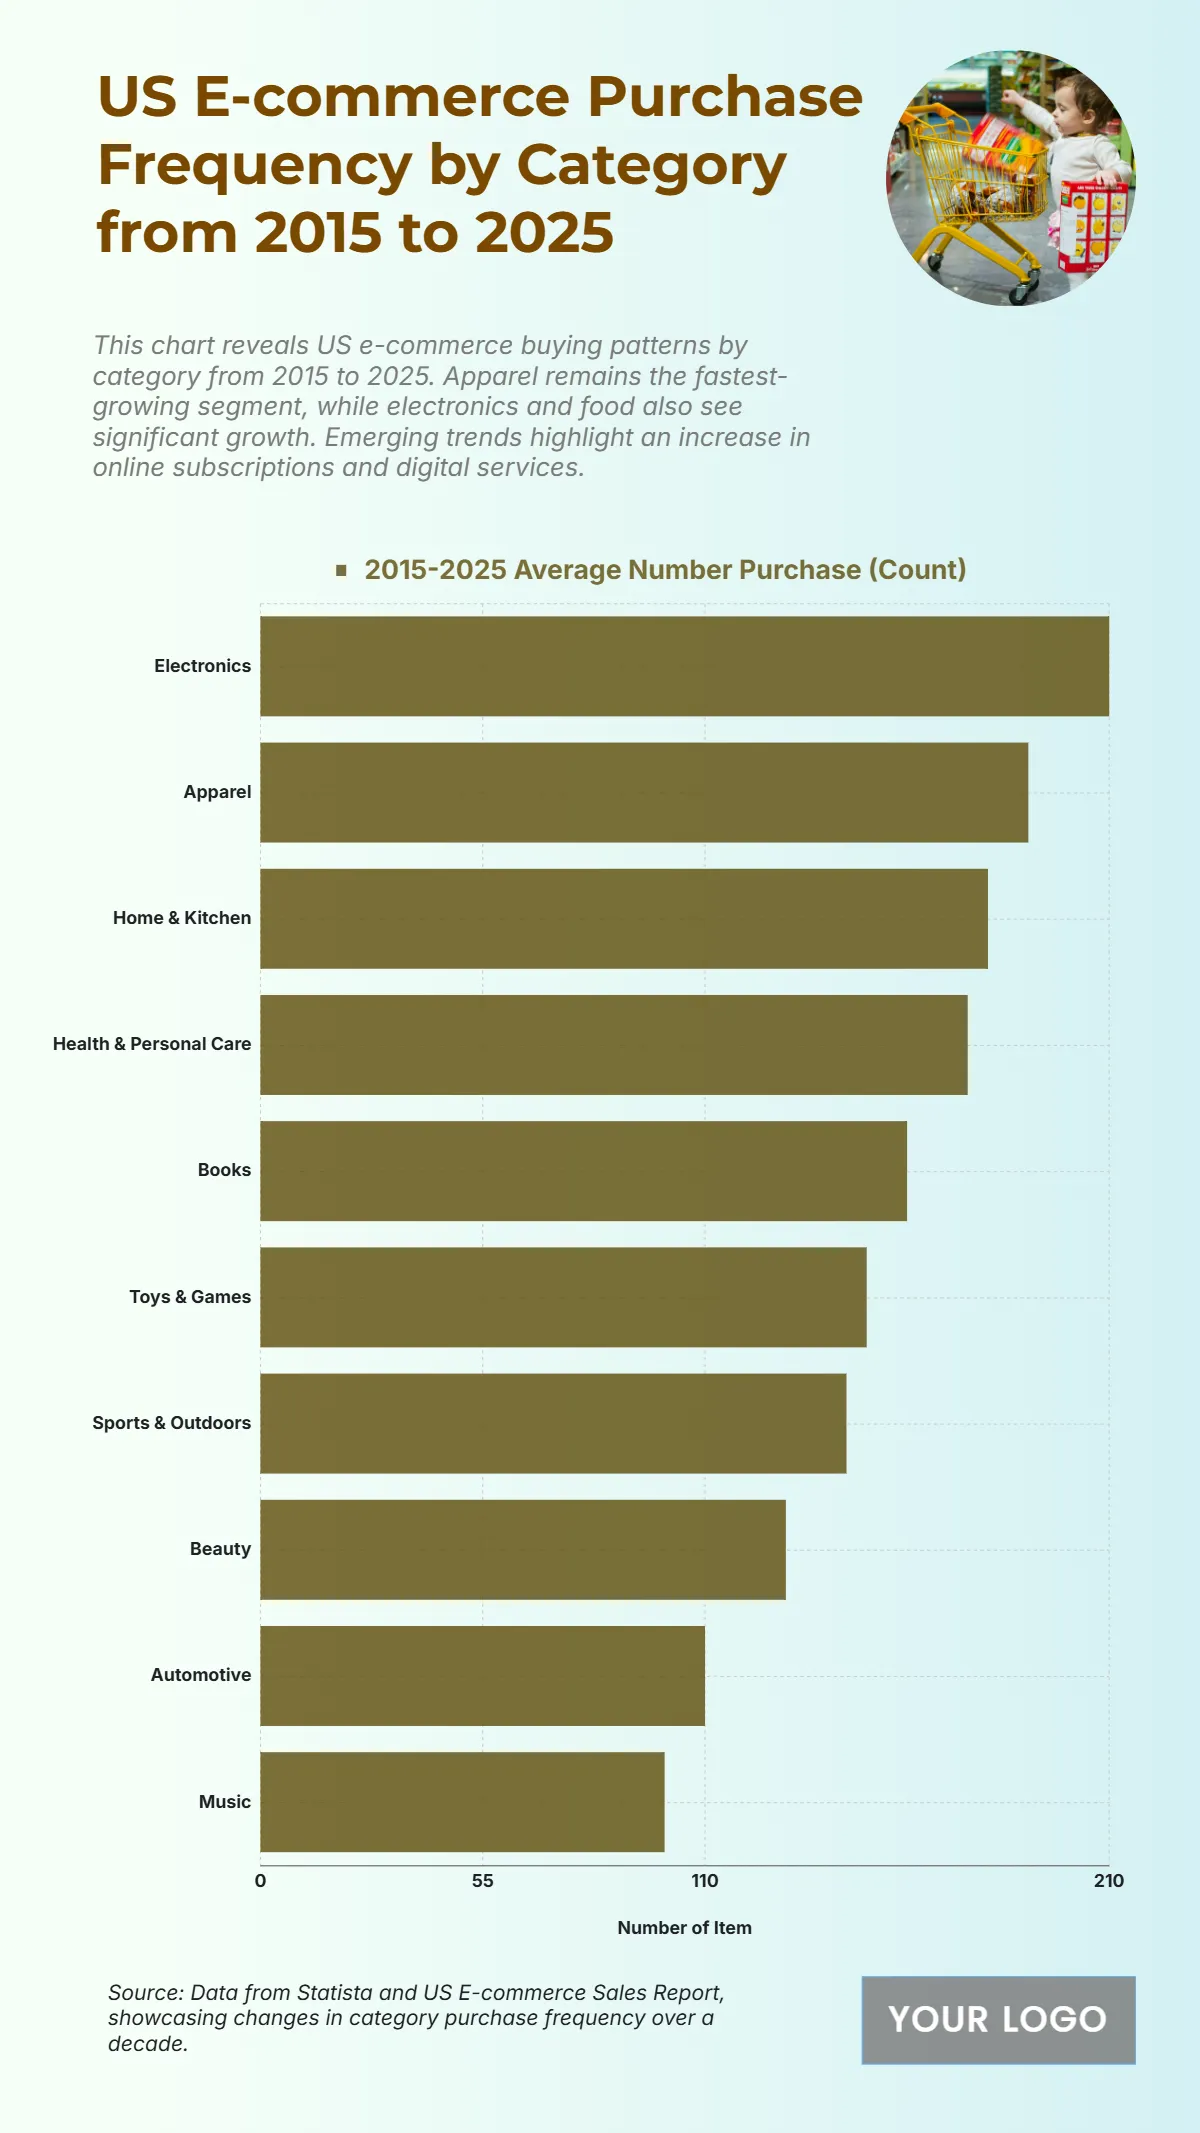
The chart shows that Electronics leads all categories in US e-commerce purchase frequency, with an average of 210 purchases from 2015 to 2025, followed closely by Apparel with 190 purchases. Home & Kitchen records 180, while Health & Personal Care follows with 175. Mid-tier categories such as Books (160), Toys & Games (150), and Sports & Outdoors (145) also show significant consumer engagement. Lower-frequency categories include Beauty (130), Automotive (110), and Music (100). These figures reflect a strong preference for technology and lifestyle products, with apparel and electronics dominating online purchasing behaviors, aligning with broader trends in consumer digital shopping habits.
| Labels | 2015–2025 Average Number Purchase (Count) |
|---|---|
| Electronics | 210 |
| Apparel | 190 |
| Home & Kitchen | 180 |
| Health & Personal Care | 175 |
| Books | 160 |
| Toys & Games | 150 |
| Sports & Outdoors | 145 |
| Beauty | 130 |
| Automotive | 110 |
| Music | 100 |


