Free US Mobile Ad Engagement by Platform from 2015 to 2025 Chart
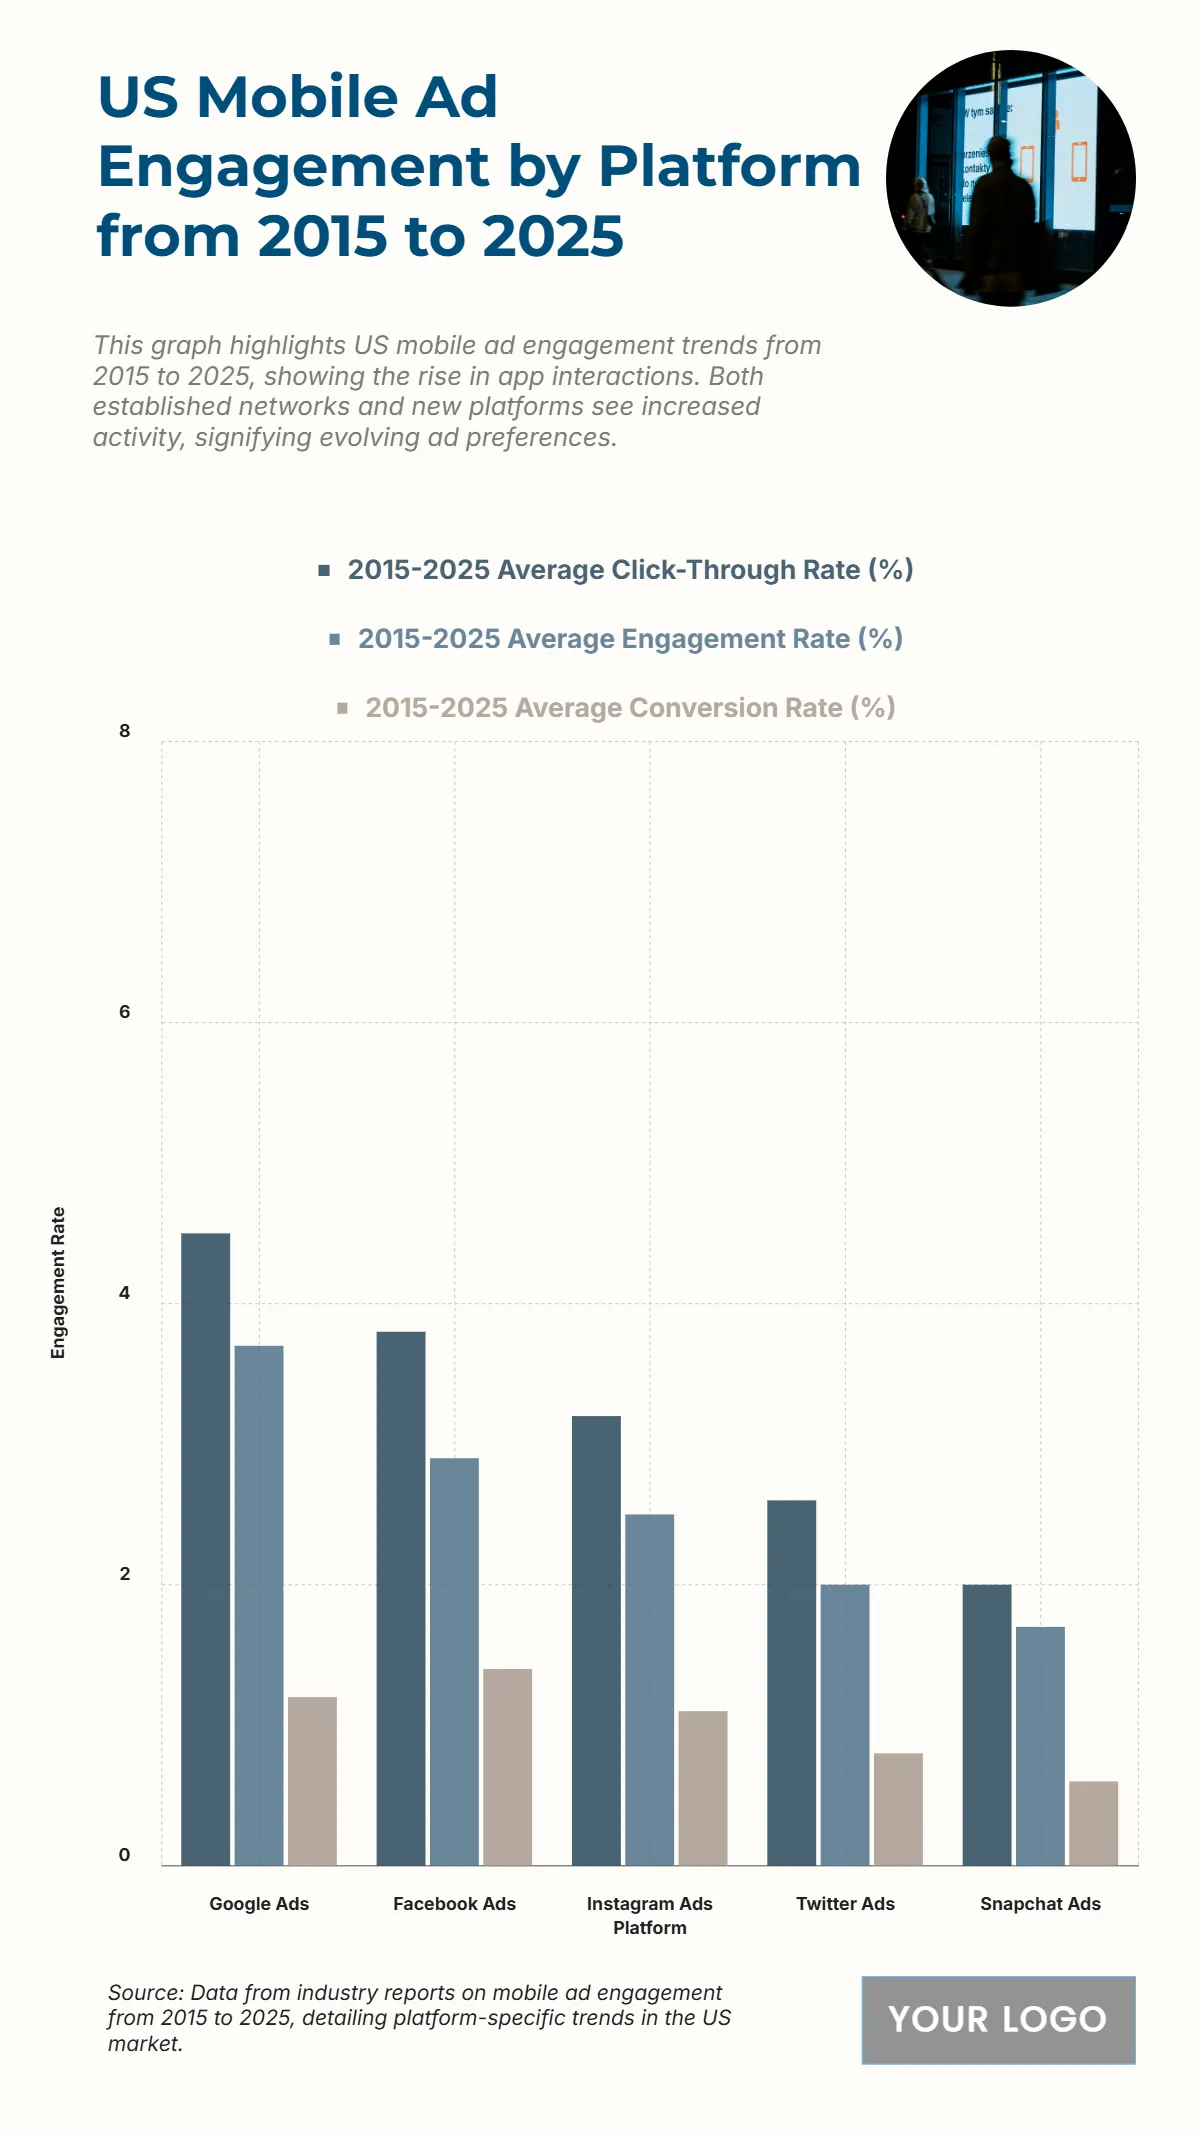
The chart shows that Google Ads leads all platforms in both click-through and engagement rates between 2015 and 2025, highlighting its dominant role in mobile advertising performance. Google recorded the highest click-through rate of 4.5% and engagement rate of 3.7%, demonstrating strong audience interaction and conversion potential. Facebook Ads follows with a 3.8% click-through rate and 2.9% engagement rate, indicating solid engagement across its user base. Instagram Ads maintains steady performance with 3.2% CTR and 2.5% engagement, showing strength among visually driven audiences. Twitter Ads records 2.6% CTR and 2.0% engagement, reflecting moderate interaction levels. Meanwhile, Snapchat Ads lags behind with 2.0% CTR and 1.7% engagement, showing lower engagement but still relevant reach among younger users. These figures emphasize how Google and Facebook continue to outperform other platforms in driving mobile ad effectiveness, while Instagram holds a strong third position in engagement performance.
| Labels | 2015–2025 Average Click-Through Rate (%) | 2015–2025 Average Engagement Rate (%) | 2015–2025 Average Conversion Rate (%) |
|---|---|---|---|
| Google Ads | 4.5 | 3.7 | 1.2 |
| Facebook Ads | 3.8 | 2.9 | 1.4 |
| Instagram Ads | 3.2 | 2.5 | 1.1 |
| Twitter Ads | 2.6 | 2.0 | 0.8 |
| Snapchat Ads | 2.0 | 1.7 | 0.6 |


