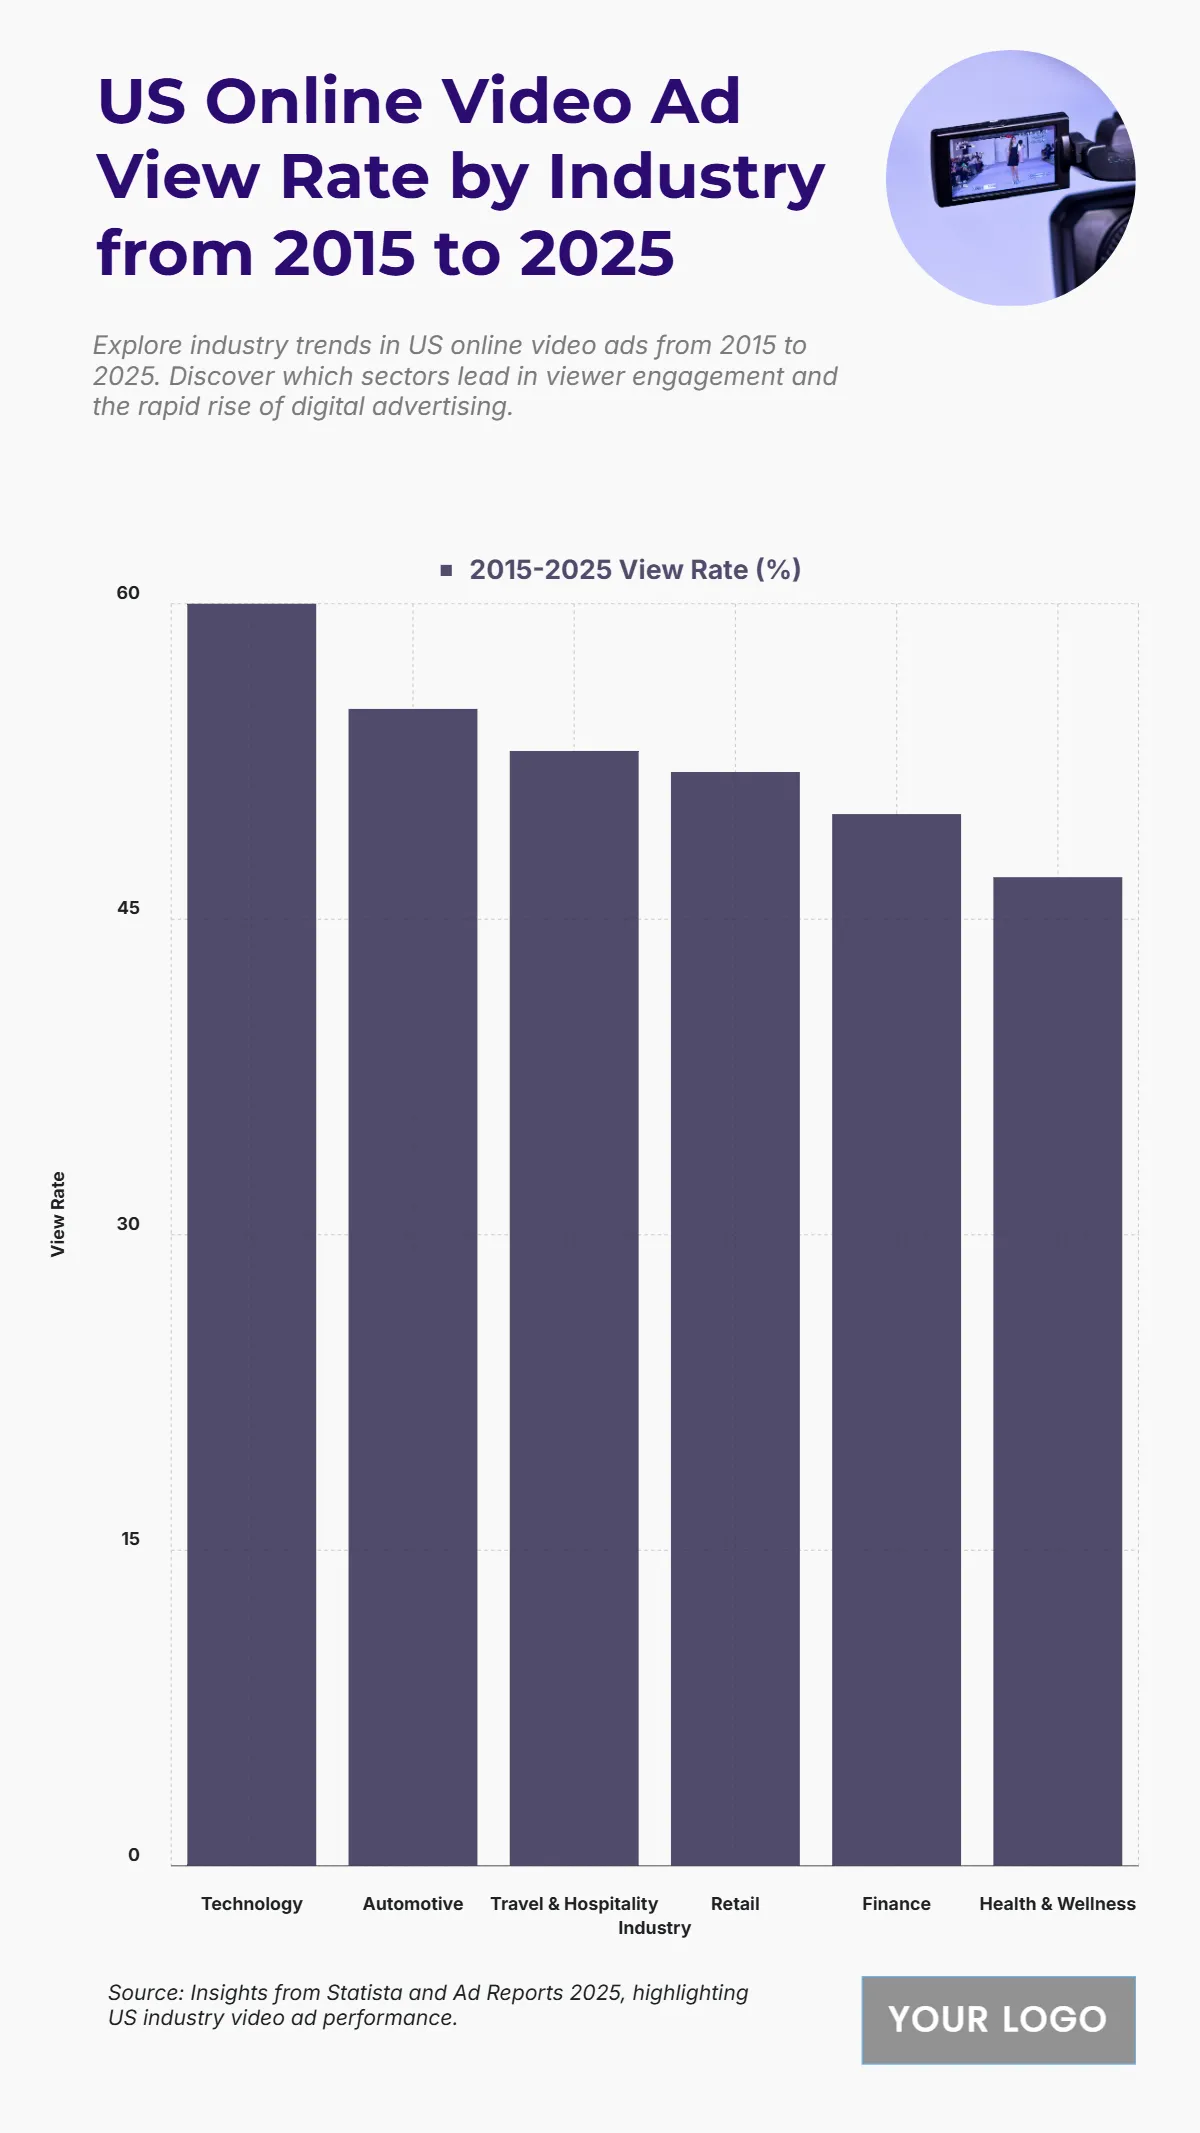
Free US Online Video Ad View Rate by Industry from 2015 to 2025 Chart
The chart shows Technology leading the US online video ad view rate at 60%, indicating strong audience engagement with tech-related content. Automotive follows at 55%, while Travel & Hospitality reaches 53%. Retail stands at 52%, and Finance follows closely with 50%, showing consistent engagement levels across industries. Health & Wellness ranks lowest at 47%, though still reflecting solid performance. These trends indicate that digital ad view rates are highest in industries with broad consumer appeal and frequent online activity, especially in tech and automotive sectors.
| Labels | 2015–2025 View Rate (%) |
|---|---|
| Technology | 60 |
| Automotive | 55 |
| Travel & Hospitality | 53 |
| Retail | 52 |
| Finance | 50 |
| Health & Wellness | 47 |


