Free US Programmatic Ad Spend by Platform from 2015 to 2025 Charts
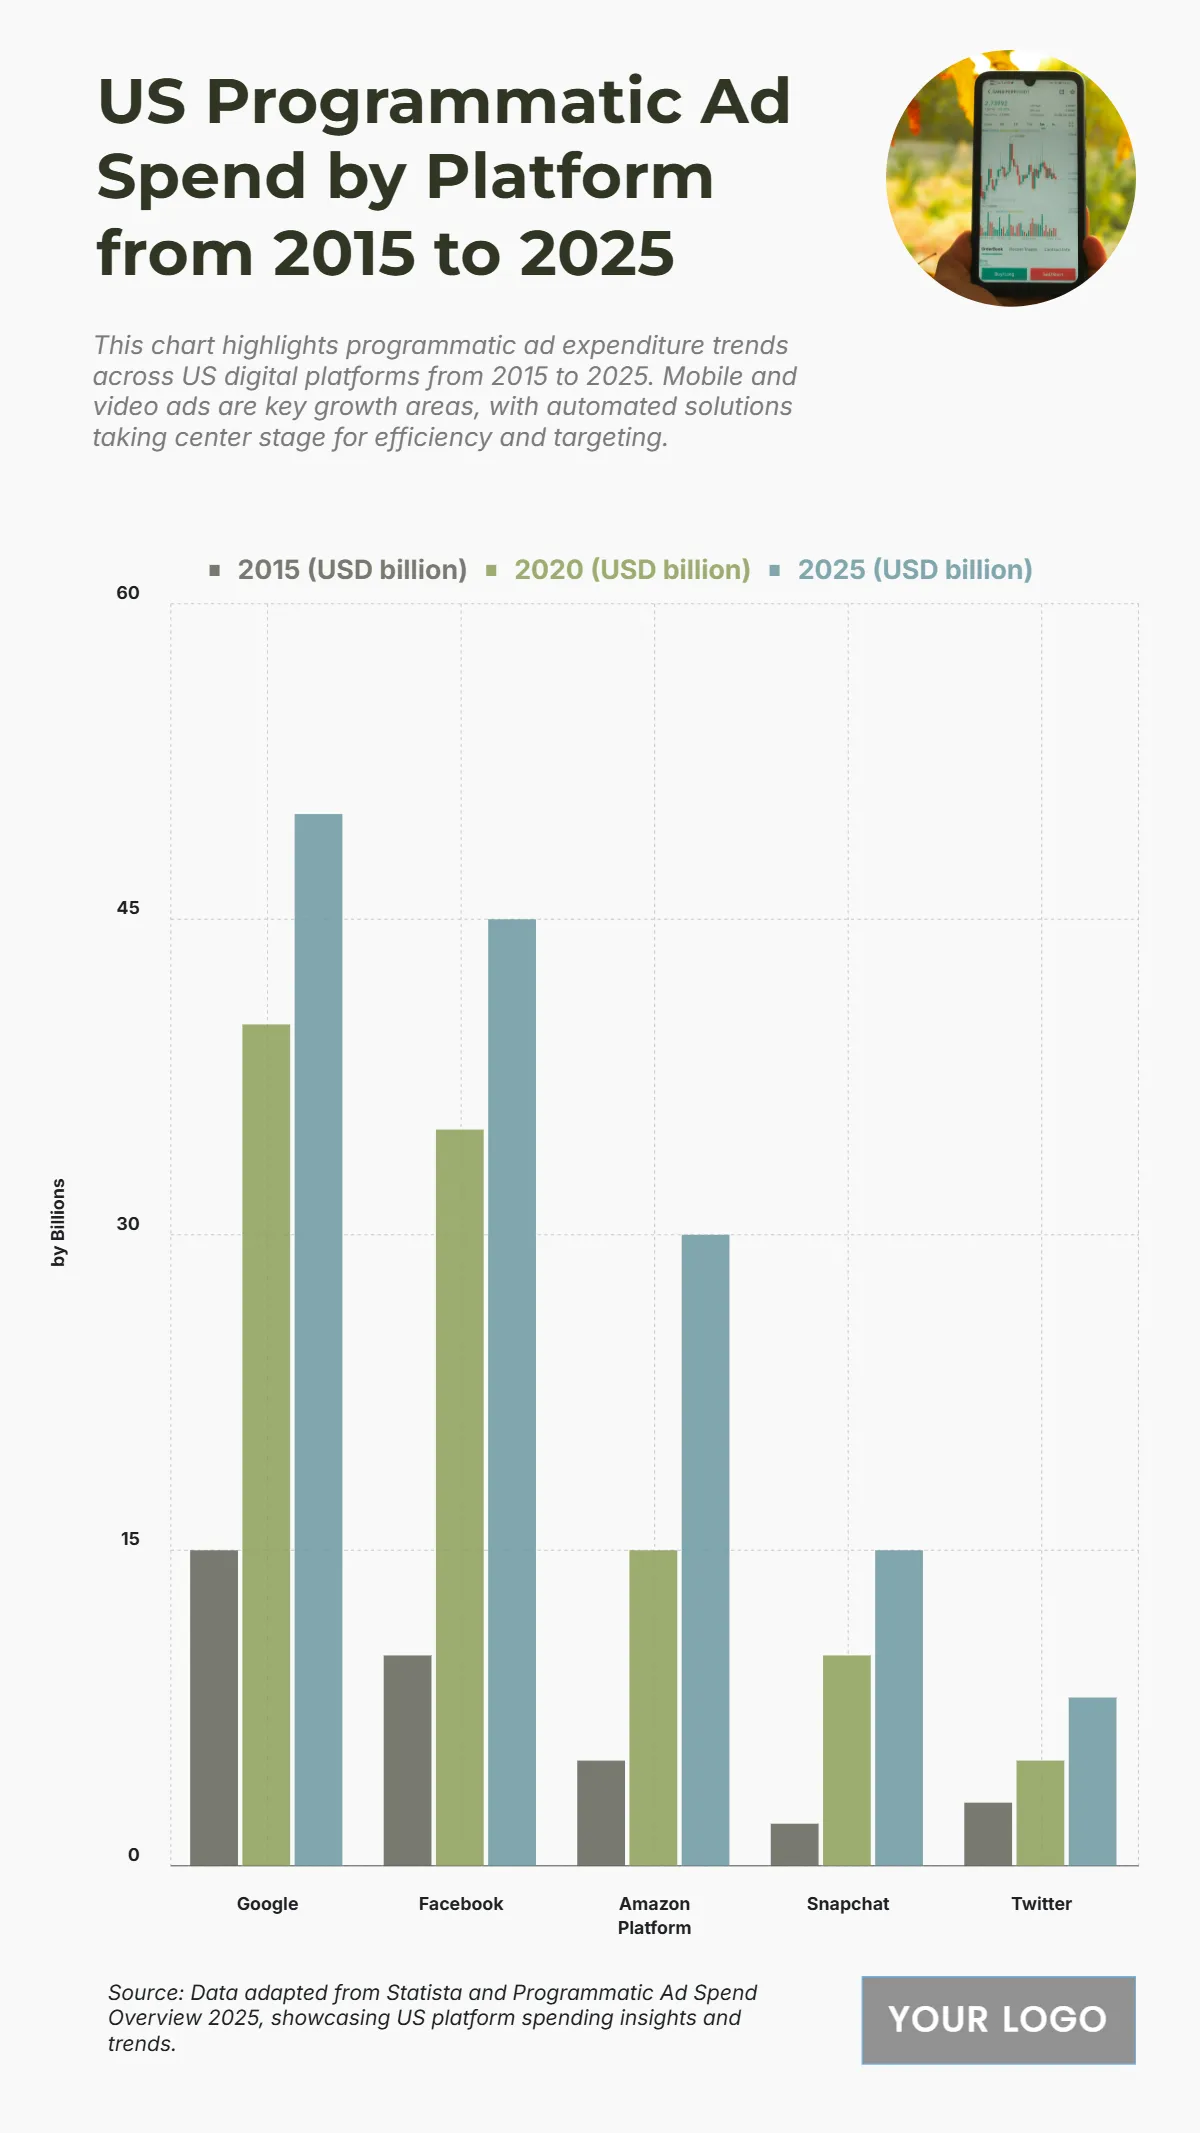
The chart shows Google leading US programmatic ad spend, growing from 15 billion USD in 2015 to 50 billion USD in 2025, reflecting its dominant advertising reach. **Facebook follows with a rise from 10 to 45 billion USD, while **Amazon climbs sharply from 5 to 30 billion USD, highlighting its rapid ad market expansion. **Snapchat grows from 2 to 15 billion USD, and Twitter from 3 to 8 billion USD. This trend reflects a clear shift toward automated digital advertising, with major platforms experiencing sustained investment over the decade.
| Labels | 2015 (USD billion) | 2020 (USD billion) | 2025 (USD billion) |
|---|---|---|---|
| 15 | 40 | 50 | |
| 10 | 35 | 45 | |
| Amazon | 5 | 15 | 30 |
| Snapchat | 2 | 10 | 15 |
| 3 | 5 | 8 |


