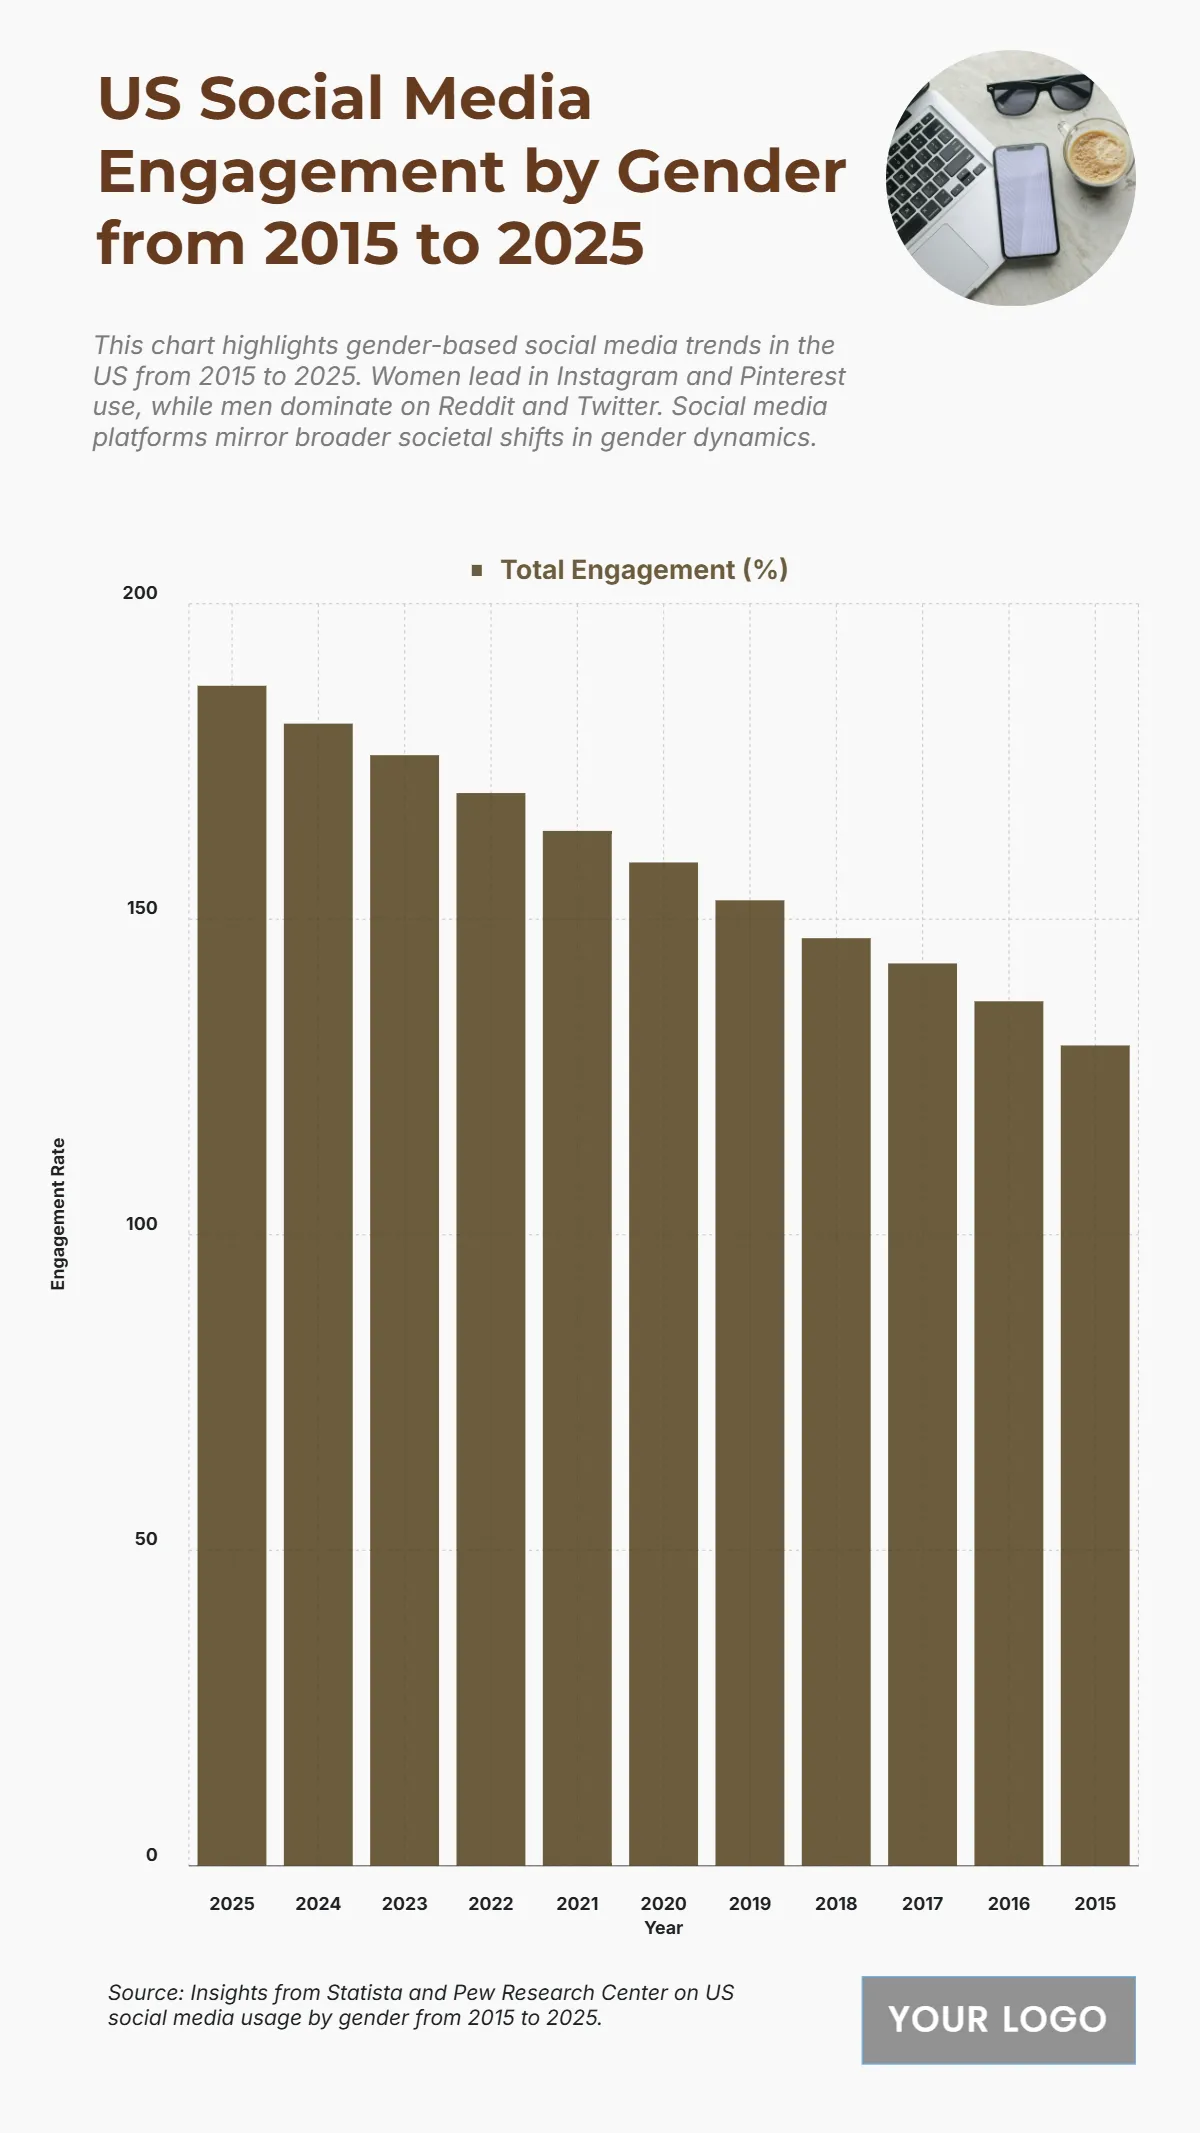
Free US Social Media Engagement by Gender from 2015 to 2025 Chart
The chart shows a steady increase in social media engagement by gender from 2015 to 2025, climbing from 130% in 2015 to 187% in 2025, representing a significant growth in platform activity. Early years saw moderate increases with 143% in 2017 and 159% in 2020, followed by a sharper climb post-2020. Engagement peaked in 2025, reflecting wider adoption of social media platforms across demographics, and the growing role of gender-based platform preferences in shaping marketing strategies.
| Labels | Total Engagement (%) |
|---|---|
| 2025 | 187 |
| 2024 | 181 |
| 2023 | 176 |
| 2022 | 170 |
| 2021 | 164 |
| 2020 | 159 |
| 2019 | 153 |
| 2018 | 147 |
| 2017 | 143 |
| 2016 | 137 |
| 2015 | 130 |


