Free US Mobile Video Ad Engagement Rate from 2015 to 2025 Chart
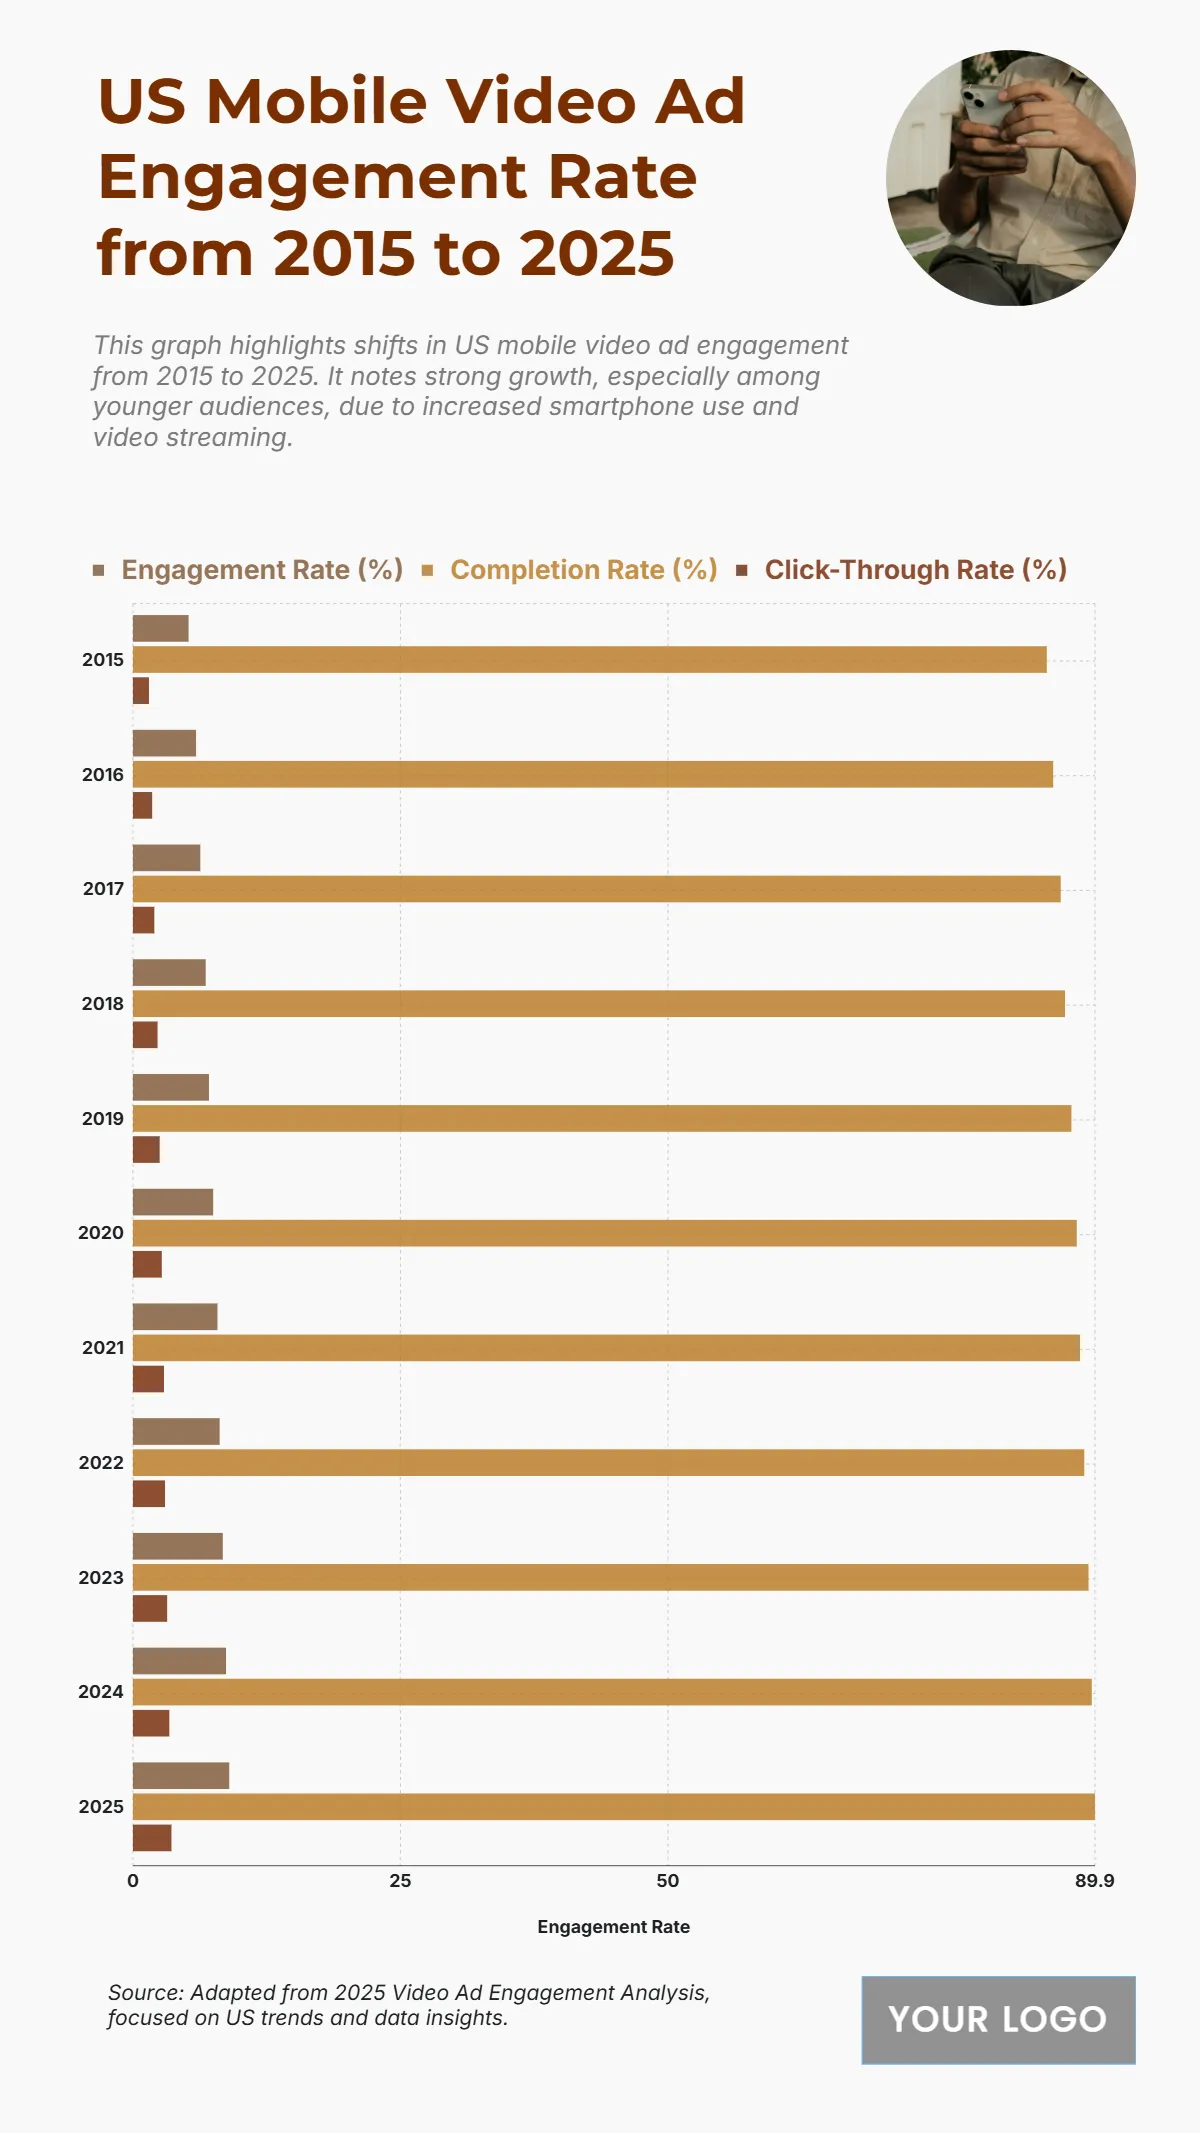
The chart shows a steady upward trend in US mobile video ad engagement between 2015 and 2025, highlighting the growing impact of mobile advertising on consumer behavior. Engagement rates rose from 5.2% in 2015 to 9% in 2025, showcasing the increasing effectiveness of mobile video formats. Completion rates also improved, climbing from 85.4% to 89.9%, which reflects higher viewer retention and sustained interest throughout the ad duration. Meanwhile, click-through rates more than doubled, rising from 1.5% to 3.6%, signaling stronger audience interaction and conversions over the years. These consistent increases demonstrate how the expansion of smartphone usage, video streaming, and targeted ad strategies have strengthened the performance of mobile video ads. The figures suggest that mobile advertising is not only retaining more viewers but also effectively driving engagement and click actions, making it a key component of digital marketing strategies through 2025.
| Labels | Engagement Rate (%) | Completion Rate (%) | Click-Through Rate (%) |
|---|---|---|---|
| 2015 | 5.2 | 85.4 | 1.5 |
| 2016 | 5.9 | 86.0 | 1.8 |
| 2017 | 6.3 | 86.7 | 2.0 |
| 2018 | 6.8 | 87.1 | 2.3 |
| 2019 | 7.1 | 87.7 | 2.5 |
| 2020 | 7.5 | 88.2 | 2.7 |
| 2021 | 7.9 | 88.5 | 2.9 |
| 2022 | 8.1 | 88.9 | 3.0 |
| 2023 | 8.4 | 89.3 | 3.2 |
| 2024 | 8.7 | 89.6 | 3.4 |
| 2025 | 9.0 | 89.9 | 3.6 |


