Free US Retail Search Ad Spend by Product Category from 2020 to 2025 Chart
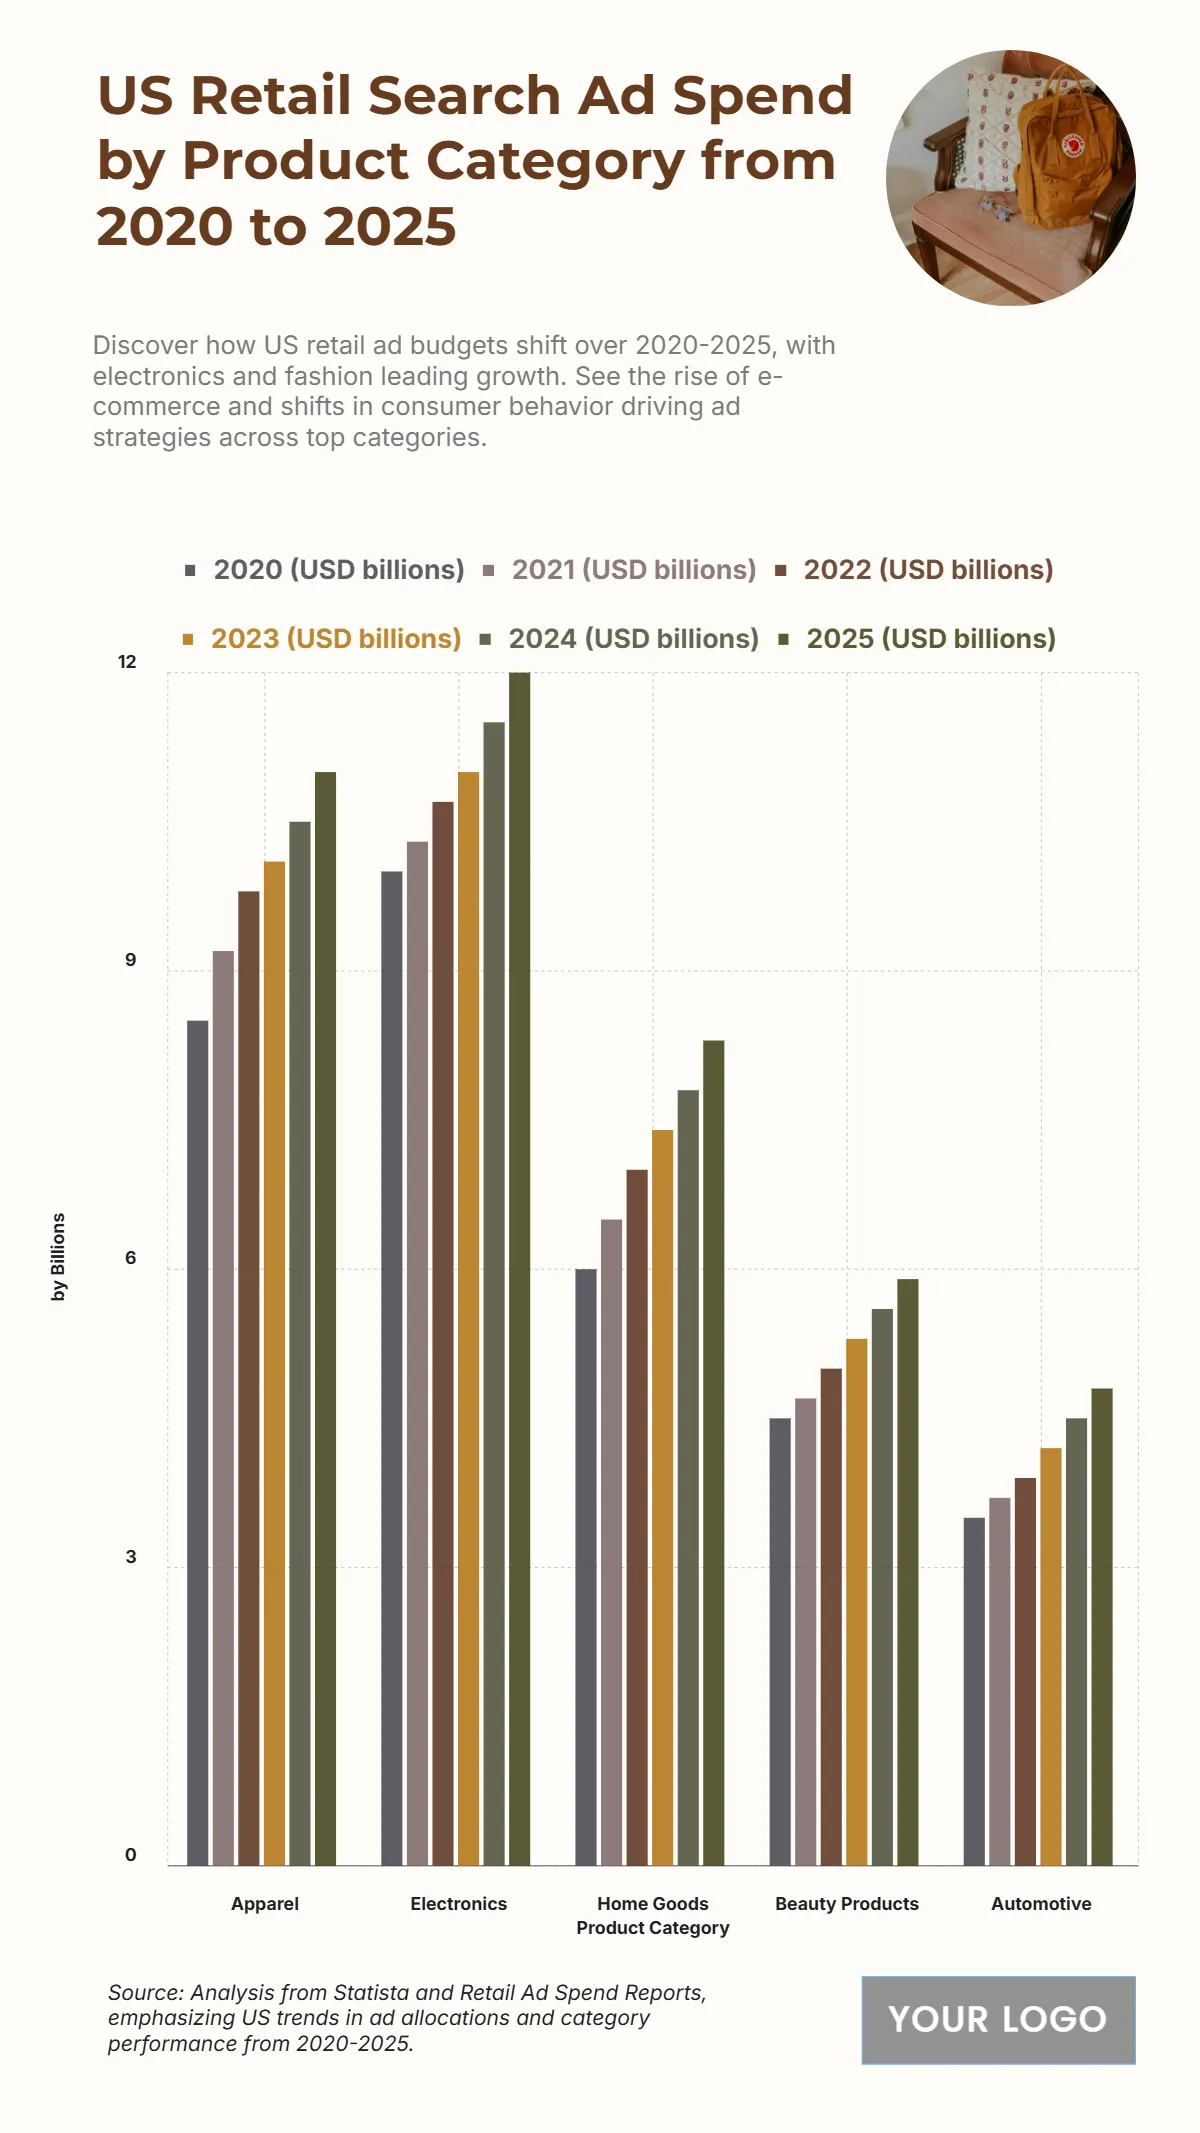
The chart illustrates the increasing retail search ad spend across major product categories in the U.S. from 2020 to 2025, with apparel and electronics leading the growth. Apparel spending grew from $8.5 billion in 2020 to $11 billion in 2025, showing a consistent upward trajectory fueled by fashion e-commerce expansion. Electronics also saw substantial growth, rising from $10 billion in 2020 to $12 billion in 2025, reflecting strong demand for tech products. Home goods increased steadily from $6 billion to $8.3 billion, while beauty products grew from $4.5 billion to $5.9 billion, highlighting stable investment in personal care advertising. Automotive, though the lowest among the categories, still rose from $3.5 billion to $4.8 billion, indicating gradual but solid growth. These figures underscore a clear prioritization of apparel and electronics in retail search ad budgets, with every category reflecting year-over-year increases driven by expanding digital retail strategies and consumer demand shifts.
| Labels | 2020 (USD billions) | 2021 (USD billions) | 2022 (USD billions) | 2023 (USD billions) | 2024 (USD billions) | 2025 (USD billions) |
|---|---|---|---|---|---|---|
| Apparel | 8.5 | 9.2 | 9.8 | 10.1 | 10.5 | 11 |
| Electronics | 10 | 10.3 | 10.7 | 11 | 11.5 | 12 |
| Home Goods | 6 | 6.5 | 7 | 7.4 | 7.8 | 8.3 |
| Beauty Products | 4.5 | 4.7 | 5 | 5.3 | 5.6 | 5.9 |
| Automotive | 3.5 | 3.7 | 3.9 | 4.2 | 4.5 | 4.8 |


