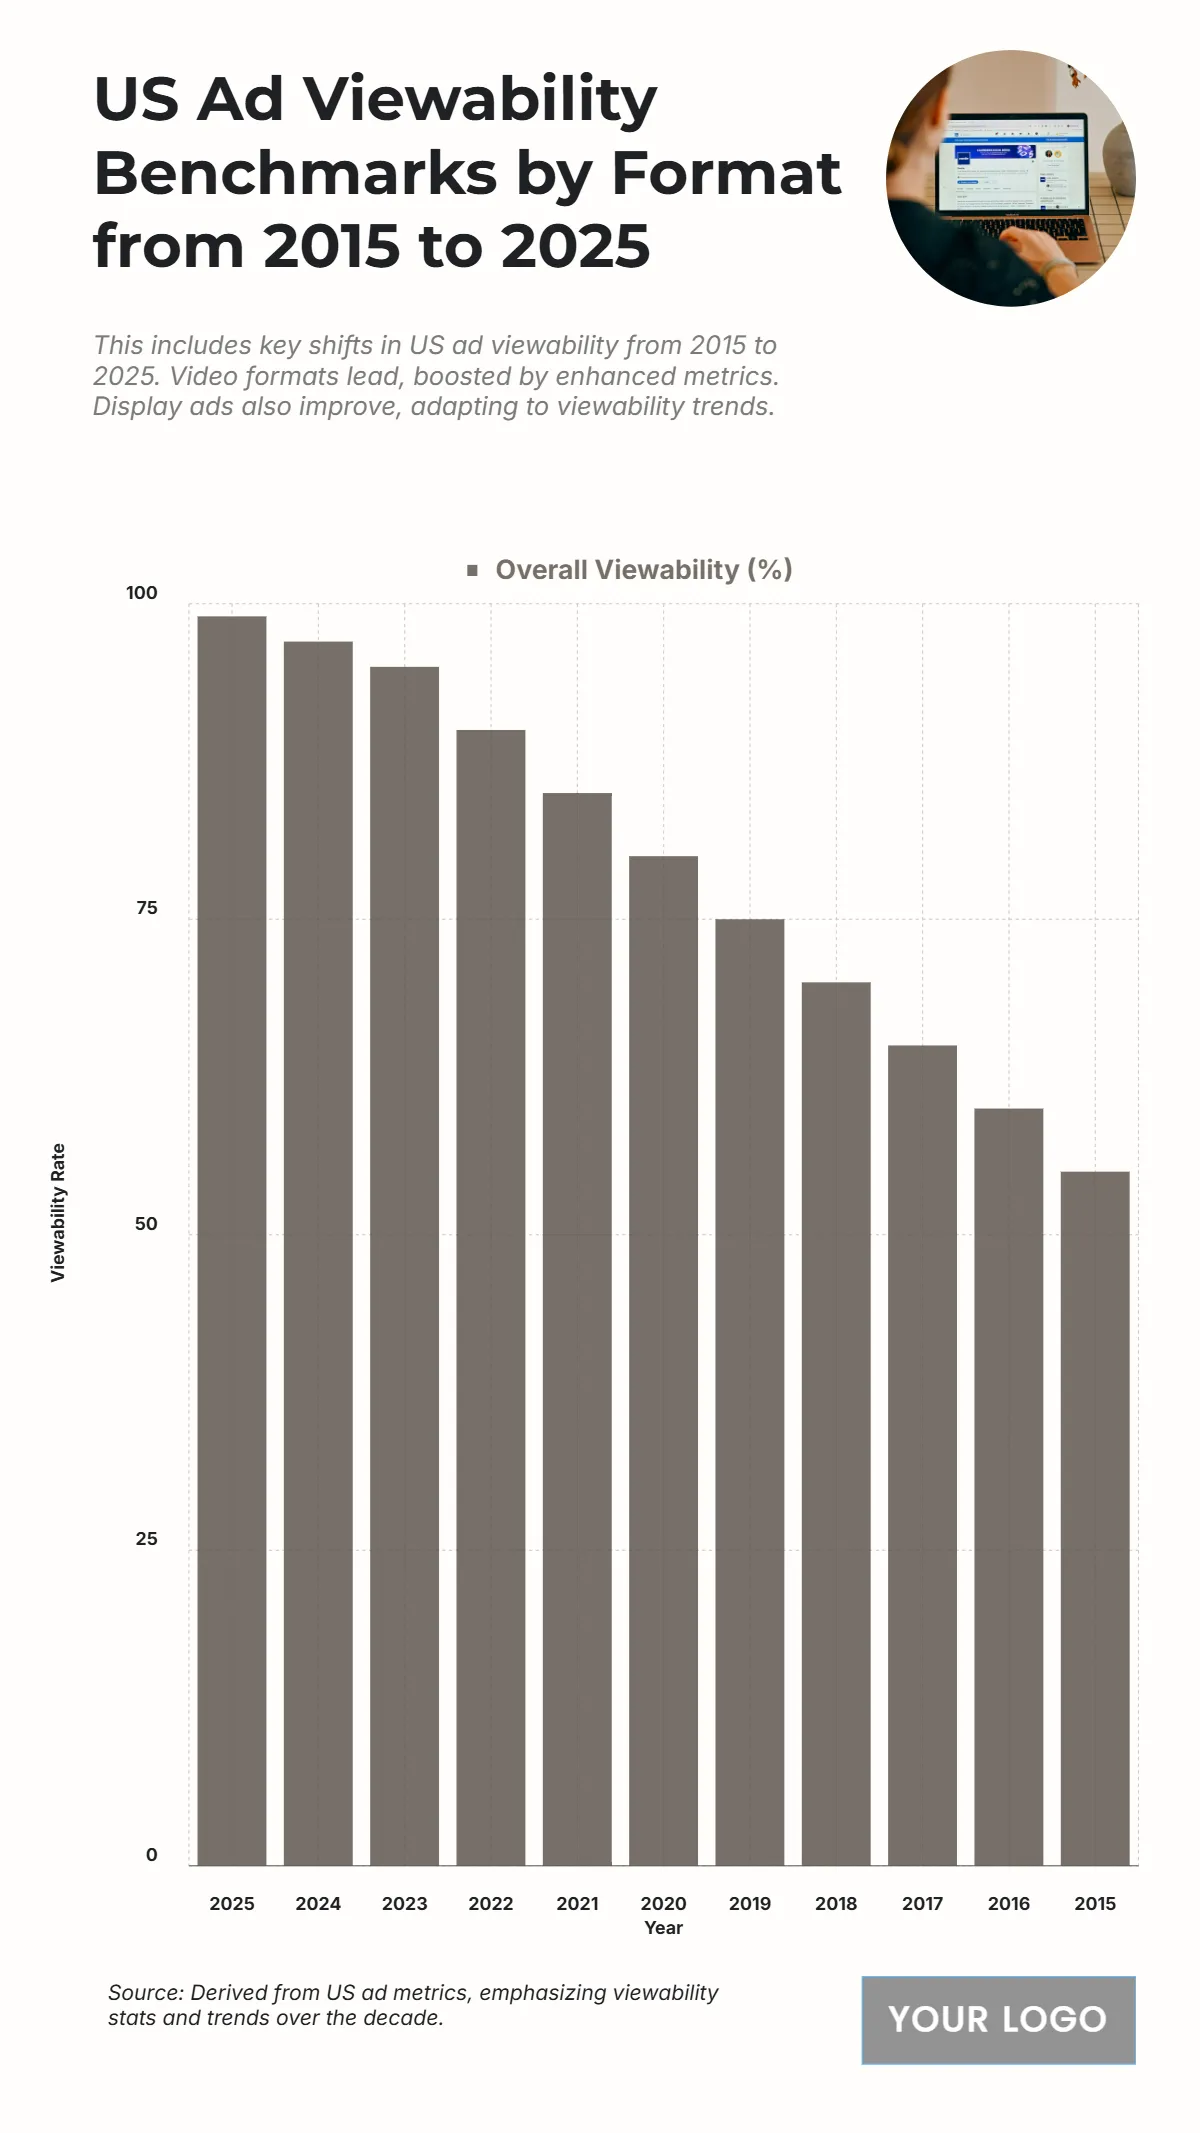
Free US Ad Viewability Benchmarks by Format from 2015 to 2025 Chart
The chart displays the Overall Viewability (%) for US Ad Viewability Benchmarks from 2015 to 2025, showing a remarkable and steady improvement in the percentage of ads that are actually viewed. The viewability rate started at its lowest point in 2015 with 55%. It then increased by 5 percentage points each year to 60% in 2016, 65% in 2017, and 70% in 2018. In 2019, the rate climbed to 75%, followed by 80% in 2020 and 85% in 2021. The improvement is projected to continue with 90% in 2022, 95% in 2023, 97% in 2024, and is expected to peak at 99% in 2025. Over the decade, the overall ad viewability rate has nearly doubled, indicating significant progress in optimizing ad formats and campaign delivery methods to ensure ads are seen by consumers.
| Labels | Overall Viewability (%) |
| 2025 | 99 |
| 2024 | 97 |
| 2023 | 95 |
| 2022 | 90 |
| 2021 | 85 |
| 2020 | 80 |
| 2019 | 75 |
| 2018 | 70 |
| 2017 | 65 |
| 2016 | 60 |
| 2015 | 55 |


