Free US Retail Advertising Spend Distribution by State from 2018 to 2025 Chart
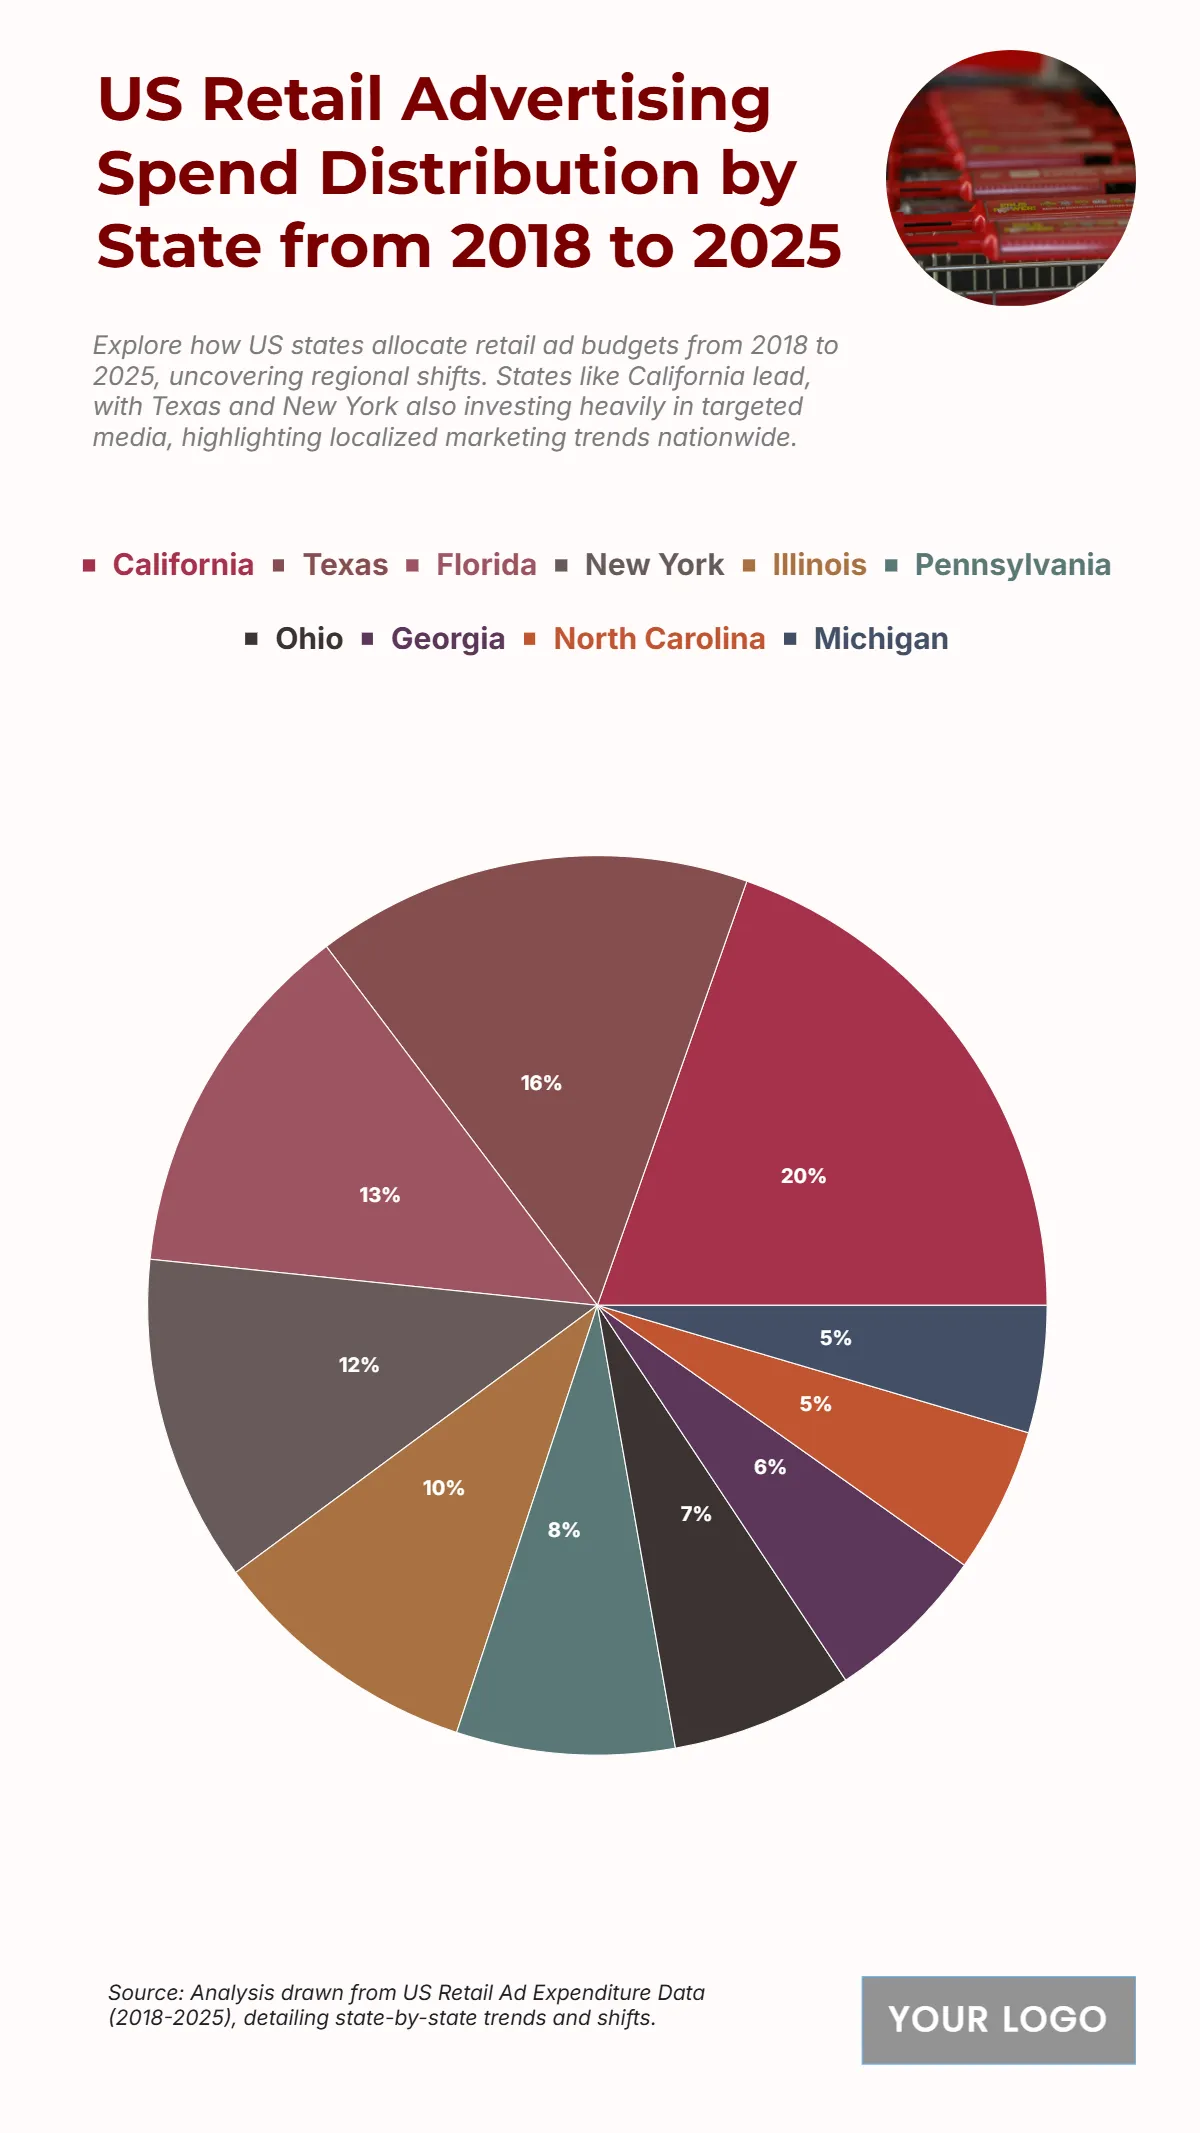
The chart shows regional spending disparities in U.S. retail advertising, with California leading at USD 150 billion between 2018 and 2025, reflecting its economic strength and consumer market size. Texas and Florida follow with USD 120 billion and USD 100 billion, respectively, showing their position as major retail hubs. New York contributes USD 90 billion, Illinois USD 75 billion, and Pennsylvania USD 60 billion, underscoring the concentration of advertising budgets in populous states. Mid-level markets include Ohio (50B), Georgia (45B), and North Carolina (40B), while Michigan (35B) rounds out the list. This allocation highlights a strong correlation between state population, retail activity, and ad spend, with top states dominating a significant portion of the national retail advertising investment.
| Labels | 2018–2025 Total Advertising Spend (Billions) |
|---|---|
| California | 150 |
| Texas | 120 |
| Florida | 100 |
| New York | 90 |
| Illinois | 75 |
| Pennsylvania | 60 |
| Ohio | 50 |
| Georgia | 45 |
| North Carolina | 40 |
| Michigan | 35 |


