Free US Digital Media Revenue Share by Format from 2015 to 2025 Chart
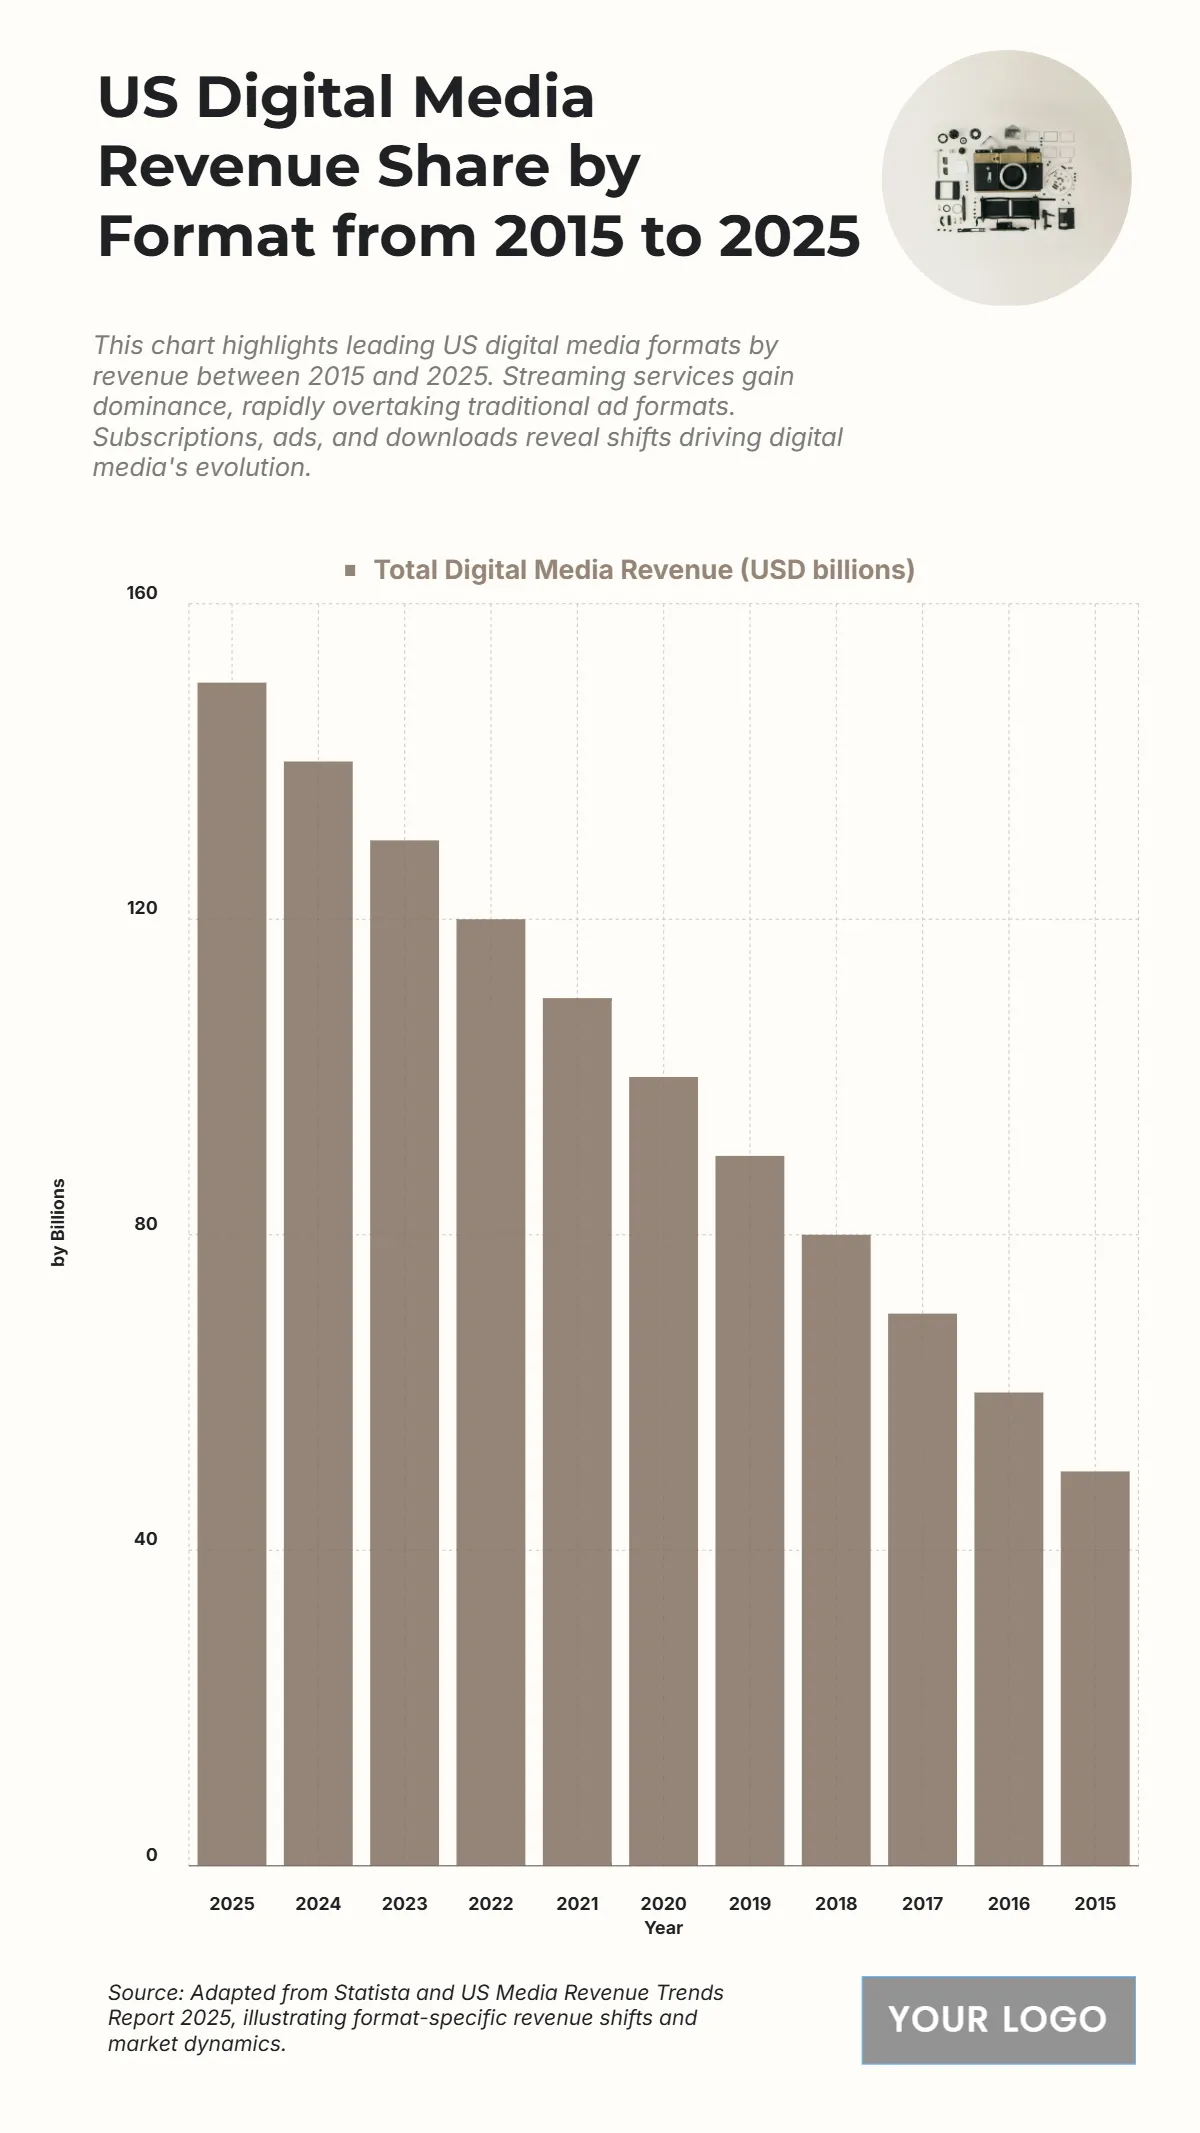
The chart displays the Total Digital Media Revenue (USD billions) from 2015 to 2025, illustrating a dramatic and continuous growth trend over the decade. The revenue started at its lowest point in 2015 with 50 billion USD. It then increased by 10 billion USD each year for the first five years, reaching 60 billion USD in 2016, 70 billion USD in 2017, 80 billion USD in 2018, and 90 billion USD in 2019. The revenue crossed the $100 billion mark in 2020, reaching exactly 100 billion USD. The growth continued with 110 billion USD in 2021, 120 billion USD in 2022, and 130 billion USD in 2023. The revenue is projected to be 140 billion USD in 2024 and peak at 150 billion USD in 2025. This represents a three-fold increase in US Digital Media Revenue over the ten-year period, underscoring the rapid and consistent expansion of the digital media advertising market.
| Labels | Total Digital Media Revenue (USD billions) |
| 2025 | 150 |
| 2024 | 140 |
| 2023 | 130 |
| 2022 | 120 |
| 2021 | 110 |
| 2020 | 100 |
| 2019 | 90 |
| 2018 | 80 |
| 2017 | 70 |
| 2016 | 60 |
| 2015 | 50 |


